Construction · OpenStats
OpenStats Building Permit Value
OpenStats
Cities ranked by total Statistics Canada building permit value in the calendar year. Rank 1 is highest value.
4 editions · 2023–2026

Quebec
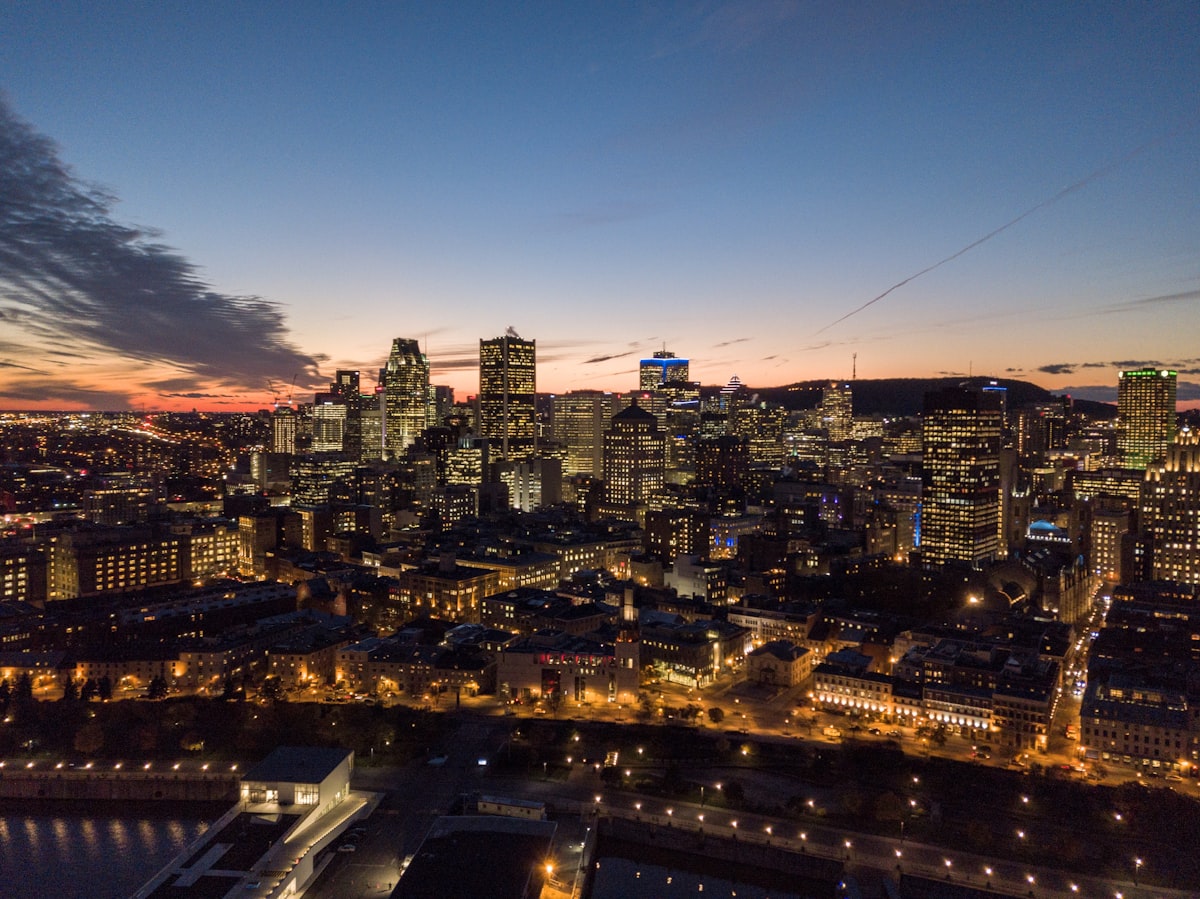
Ville-Marie under the mountain
Montreal sits on an island where First Nations farmed and traded for centuries before Jacques Cartier visited Hochelaga in 1535. French colonists founded Ville-Marie in 1642; the city later took its name from Mount Royal, the triple-peaked hill in the middle of everything.
Fur, factories, and two languages shaped neighbourhoods that still argue cheerfully about bagels, highways, and winter. Staircases climb the mountain, festivals fill the streets, and the river keeps score.
Use the topic buttons for permits, tax, internet, radon, hazards, and water when you want numbers for Montreal.
Drawn from Wikipedia.
Open the live numbers for Montreal. Each link goes to the original topic page for this city.
When Montreal moves in a ranking, posts new permit figures, or lands in a study, get a short note. A few sends a year, only when something changes.
No spam. Unsubscribe with one reply.
The green line averages OpenStats-owned rankings (radon, permit value, mill rates). Grey dots mark every published placement across all studies below.
Each study below is its own ranking. Where a study has more than one edition for this city, the chart shows standing across those years only.
Construction · OpenStats
OpenStats
Cities ranked by total Statistics Canada building permit value in the calendar year. Rank 1 is highest value.
4 editions · 2023–2026
Composite · OpenStats
OpenStats
Average standing across OpenStats-owned rankings built from public data (currently radon, building permit value, and residential mill rates). Each placement is scored from 0–1 within its edition, then averaged. External livability lists stay on hometown pages as separate published appearances.
Single edition · 2026
Only one published edition places Montreal in this study so far. Open the edition for method notes and the full table.
Health · OpenStats
OpenStats
Communities ranked by Health Canada survey mean indoor radon (Bq/m³). Rank 1 is the highest mean.
Single edition · 2026
Only one published edition places Montreal in this study so far. Open the edition for method notes and the full table.
Housing
Canada Mortgage and Housing Corporation
Average rent for purpose-built 2-bedroom apartments (all tenants) from CMHC Rental Market Survey. Rank 1 = lowest average rent among covered CMAs.
Single edition · 2025
Only one published edition places Montreal in this study so far. Open the edition for method notes and the full table.
Housing
Canada Mortgage and Housing Corporation
Purpose-built rental apartment vacancy rate from CMHC Rental Market Survey (October). Rank 1 = highest vacancy (most available rental stock among covered CMAs).
2 editions · 2024–2025
Housing
Demographia / Frontier Centre for Public Policy
Canadian subset of Demographia median multiple (median house price / median household income). Rank 1 = most affordable (lowest median multiple) among Canadian major markets in the international survey.
3 editions · 2024–2026
Livability
Economist Intelligence Unit
Ranks ~173 cities on stability, healthcare, culture & environment, education, and infrastructure. Full dataset is paid; OpenStats stores only ranks and scores published in free press releases and news coverage.
3 editions · 2023–2025
Quality of life
Mercer
Expat-oriented quality of living ranking across 39 factors in 10 categories. OpenStats stores Canadian cities named in free Mercer press releases (typically top-25 highlights), not the full paid ranking.
2 editions · 2023–2024
Livability
MoneySense
Annual composite ranking of Canadian municipalities on economy, housing, crime, health, and weather.
5 editions · 2014–2018
Housing
National Bank of Canada Economics and Strategy
Ranked by Mortgage Payment as a Percentage of Income (MPPI) on a representative home. Rank 1 = highest MPPI (least affordable). Free quarterly Housing Affordability Monitor tables.
2 editions · 2025–2026
Quality of life
Numbeo
Crowd-sourced composite Quality of Life Index. Historical snapshots are free on Numbeo ranking pages; OpenStats cites Canadian cities from those public pages (cite_only). Higher index scores are better; ranks are global position on the snapshot page.
3 editions · 2024–2026
Housing
RBC Economics
Ranked by RBC aggregate Housing Affordability Measure (% of median pre-tax household income for mortgage, property taxes, and utilities on a benchmark home). Rank 1 = highest ownership-cost burden (least affordable). CMA markets mapped to primary city slugs.
2 editions · 2024–2025
Distinctive local notes and places, each linked to its source.
Founded in 1642 as Ville-Marie, or "City of Mary", it now takes its name from Mount Royal, the triple-peaked mountain around which the early settlement was built.
The city is centred on the Island of Montreal and a few, much smaller, peripheral islands, the largest of which is Île Bizard.
It lies 196 kilometres (122 mi) east of the national capital, Ottawa, and 258 kilometres (160 mi) southwest of the provincial capital, Quebec City.
Montreal is the second-largest primarily French-speaking city in the world after Paris.
Designed by Buckminster Fuller, this Expo 67 geodesic dome relic survived fire and ice and now houses an environment museum on Île Sainte-Hélène.
This 1967 modular concrete housing experiment was designed as a new model for urban living and still anchors Montreal's harbour skyline.
A giant orange-shaped roadside restaurant serving the city's signature citrus drink has been a skyline oddity since the mid-20th century.
City law keeps this mountaintop basilica the tallest building in town; it houses the heart of Brother André, a locally venerated saint.