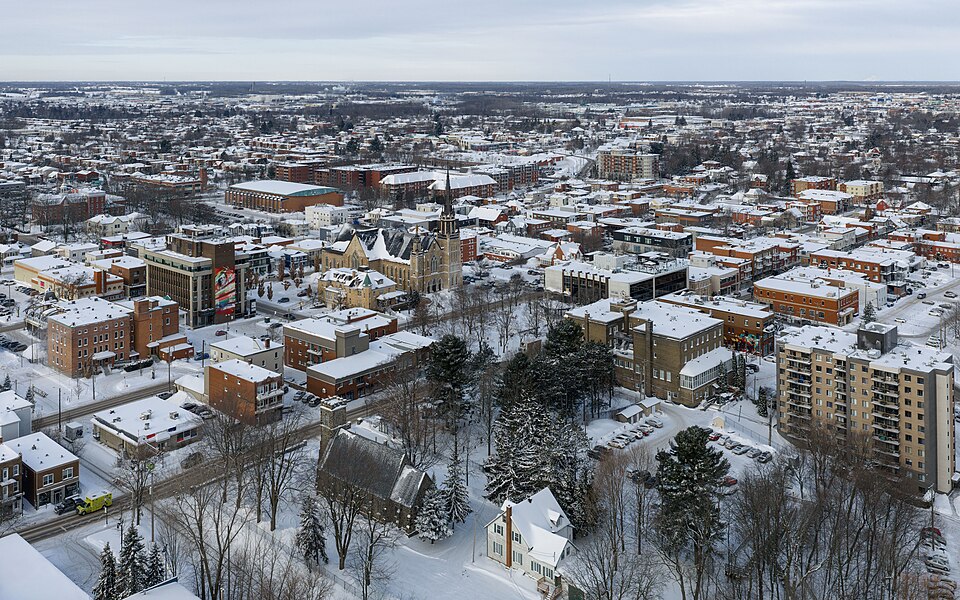
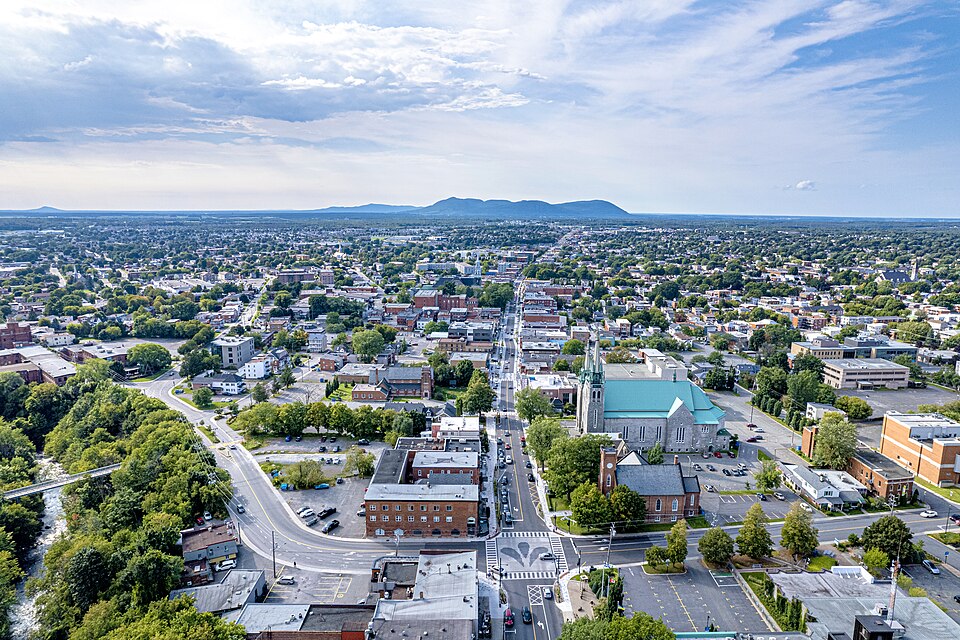
Laval, Quebec
Wikimedia Commons via Wikipedia

Quebec · Civic arena

Laval

Laval drinking water hardness is 253 mg/L on OpenStats, plus City Score rankings and local readings.

Civic arena · hometown HUD

Laval

City438k pop
44XP
#259

#259 of 343

44% City Score XP

DirectSurface
City Score XP

7/8 pillars on the board

44%#259

Decade trail

Laval packs 7 of eight open-data pillars into its composite standing. Tap a rival below to see how the hometown stacks up head-to-head.

Laval drinking water

Direct municipal reading

Hardness, pH, and lead from municipal reports on the OpenStats water atlas.

Hardness
253 mg/L
very hard
pH
7.1
Lead
0.5 μg/L

Full Laval water quality report →City Score rankingsCompare cities · vs Dolbeau-Mistassini · vs Sainte-Agathe-des-MontsHardness guide

Watershed to tap · system map

How Laval's water works

Open full map

Source, treatment, and distribution for Laval from municipal and provincial water records. Hardness and grade are published readings.

Local numbers for Laval

Drinking water first, then permits, tax, internet, radon, and hazards for Laval.

How Laval scores

Laval sits at City Score rank #259 with a standing of 44%, from 7 of 8 open-data pillars (tax, construction, connectivity, indoor air, water, seismic hazard, growth, safety). Missing pillars score at median standing so thin coverage cannot inflate the rank. The chart below shows how that standing moves year to year.

Latest owned placements: building permit value rank #196 of 343 (2025); indoor radon rank #178 of 343 at 153 Bq/m³ survey mean; residential mill rate rank #230 of 343 (8.87 mill rate). Full tables and method notes live on each study edition; atlas readings for the same slug open from the topic buttons.

#259
Arena rank (of 343)
44%
City Score
7
Pillars observed

Arena loadout

Topic XP bars

Arena rank #259 of 343

City Score

7/8 pillars · main XP bar

44%#259
Drinking water

Rank #42

12%
Building permits

Rank #196

43%
Internet

Rank #303

12%
Radon

Rank #178

52%
Hazards

No placement

Property tax

Rank #230

67%

Achievements

Direct municipal readingSurface water supply

Hometown notes

Archive

Earlier years: 2026 · 2025 · 2024 · 2023

Laval in brief

Laval introduces itself as an island before it introduces itself as a suburb. Découvrez votre île is the municipal home line, and Lavallois lean on that geography when they talk about parks, pools, and traffic in the same breath. Centre de la Nature is the big green lung, the place outdoor cinema nights and eco workshops show up on the city calendar. Smaller parks keep their own names in the summer grid: Parc Champfleury, Parc Pie-X, Parc des Saules, Parc Rodolphe-Lavoie, and Parc du Royal-22e-Régiment. That list matters because Laval residents navigate by park names as readily as by arterial roads.

Civic life runs through Mon Dossier and a steady diet of neighbourhood programming. Bibliothèque Sylvain-Garneau and Bibliothèque Yves-Thériault host teen and poetry nights while the Pôle culturel Montmorency anchors the culture menu. The loudest policy file on the home page is health: Laval wants its juste part, and the hospital expansion campaign is framed as ready since 2018 and still waiting. Free trees and fireplace subsidies share space with that urgency, which is a very Laval mix of green gesture and hard service demand. Une île d'exceptions is the companion tagline on the city site, and it fits a place that argues for hospital capacity while posting cinema nights at Parc Champfleury the same week.

On the OpenStats City Score for 2026, Laval sits at rank 89 of 125. The hometown read stays island-first: not downtown Montreal, not a generic North Shore label, but a city that keeps saying île out loud and then sends you to Centre de la Nature when you need proof. Island first, then parks, then the hospital file: that order is the local desk version of Laval.
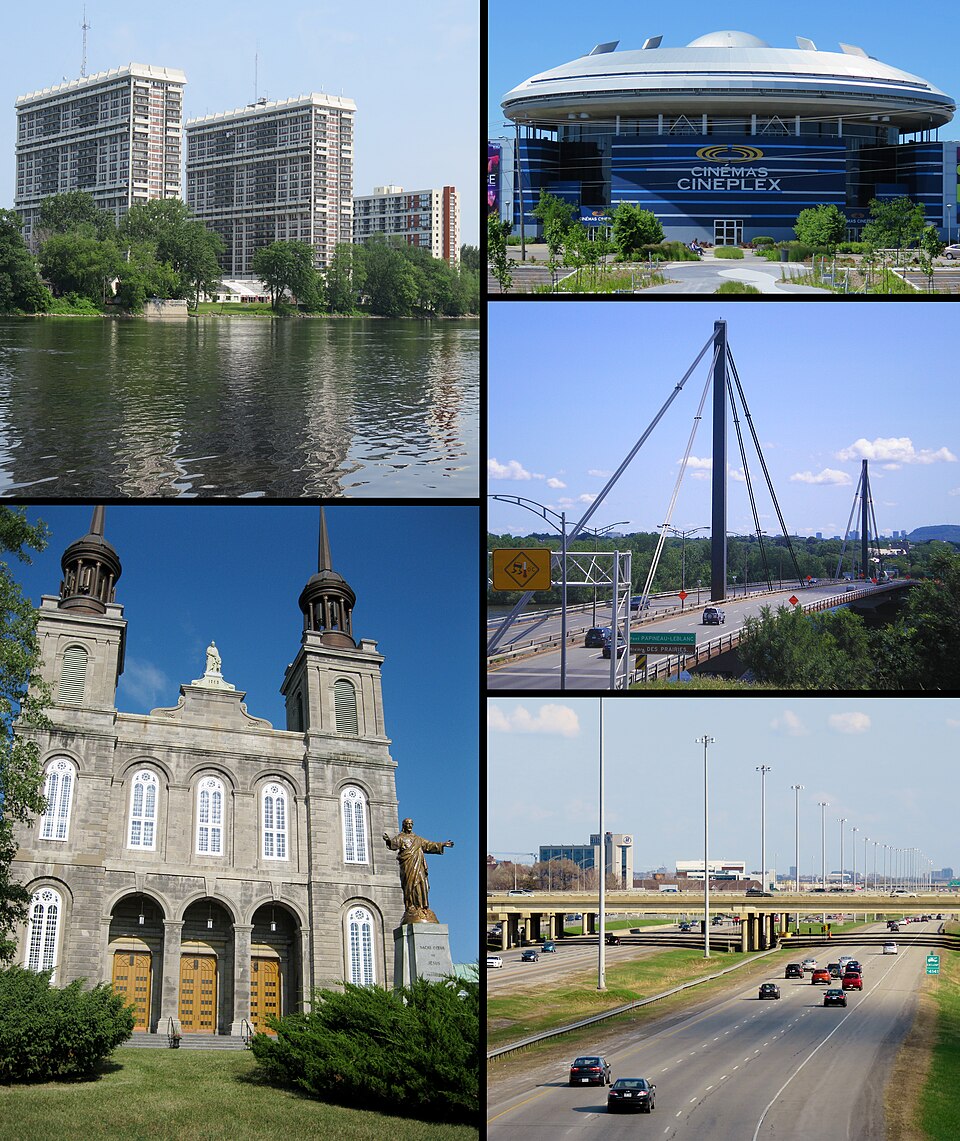
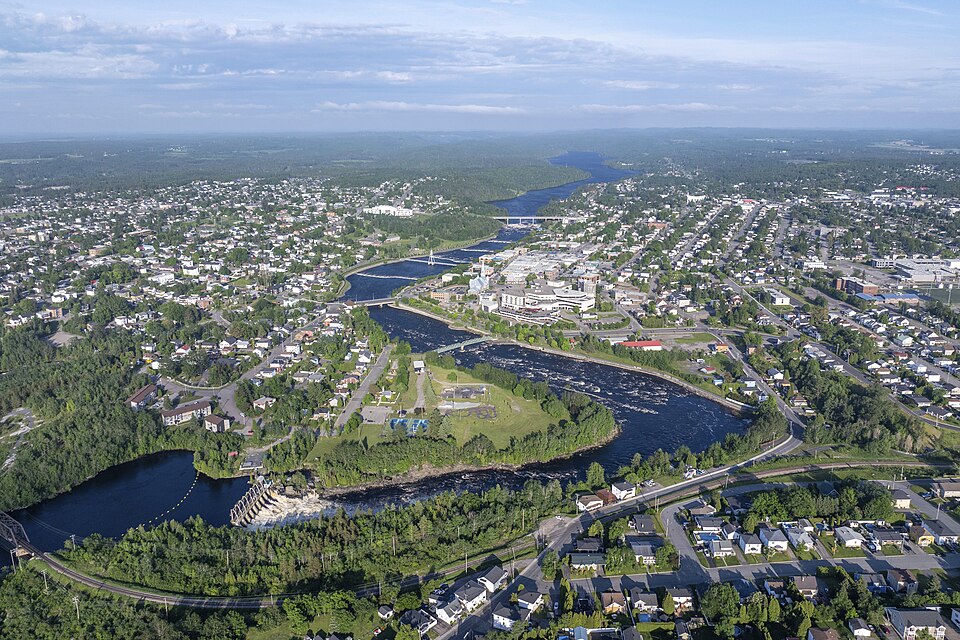
Drawn from Ville de Laval, Centre de la Nature.

City Score over time

City Score from 2016–2025 across eight open-data pillars. Individual study placements are listed in the panels below.

0%25%50%75%100%2016201720182019202020212022202320242025
OpenStats City Score

Rankings for Laval

Each study below is its own ranking. Where a study has more than one edition for this city, the chart shows standing across those years only.

Connectivity · OpenStats

OpenStats Broadband Download Speeds

OpenStats

Cities ranked by estimated best advertised download (Mbps). Anchored to the current ISED National Broadband Data vintage, then backcast along a national speed curve with city-specific fiber-arrival and 50/10 availability paths so relative ranks can change over the decade. Not a claim of audited historical hex maps for every year.

10 editions · 2016–2025

#303
Latest · 2025 · of 343
Score 152.2

Construction · OpenStats

OpenStats Building Permit Value

OpenStats

Cities ranked by calendar-year building permit value. Direct rows sum Statistics Canada Table 34-10-0292-01. Cities without a direct reading use population × provincial per-capita permit intensity (estimated), so every seed city has a year-varying construction signal.

10 editions · 2016–2025

#196
Latest · 2025 · of 343
Score 411114165

Composite · OpenStats

OpenStats City Score

OpenStats

Dimensional average of OpenStats open-data pillars for each panel year 2016–2025: tax, construction, connectivity, indoor air, water, seismic hazard, population growth, and crime severity. Each series is scored 0–1 within its edition; series in the same pillar are averaged, then all eight pillars are averaged with equal weight. Missing pillars score at median standing (0.5). Growth and CSI use StatCan annual tables; permits, mill rates, and broadband use live rows plus documented year-varying estimates where needed. Radon, water, and PGA may be survey/model vintages carried forward and are flagged when static for more than two years. External commercial livability lists are never inputs.

10 editions · 2016–2025

#259
Latest · 2025 · of 343
Score 0.437

Safety · OpenStats

OpenStats Crime Severity Index

OpenStats

Communities ranked by Statistics Canada Crime Severity Index (Table 35-10-0026-01). Rank 1 is highest CSI (worse). Values are CMA where a metro match exists, otherwise provincial CSI. Hometown pages label the grain.

10 editions · 2016–2025

#208
Latest · 2025 · of 343
Score 61.55

Water · OpenStats

OpenStats Drinking Water Hardness

OpenStats

Communities ranked by municipal drinking-water hardness (mg/L as CaCO₃). Hardness changes slowly; the atlas vintage is carried across panel years and flagged when static for more than two years.

10 editions · 2016–2025

#42
Latest · 2025 · of 343
Score 253

Health · OpenStats

OpenStats Highest Indoor Radon

OpenStats

Communities ranked by Health Canada survey mean indoor radon (Bq/m³). Rank 1 is the highest mean. Decade panel years without a new survey carry the CMA survey vintage forward; they are not annual retests.

10 editions · 2016–2025

#178
Latest · 2025 · of 343
Score 153

Growth · OpenStats

OpenStats Population Growth

OpenStats

Cities ranked by year-over-year population growth from Statistics Canada annual CSD estimates (Table 17-10-0155-01). Rank 1 is fastest growth. A few places without a clean CSD match use a provincial-path estimate anchored to seed population.

10 editions · 2016–2025

#210
Latest · 2025 · of 343
Score 0.007457001089298461

Property tax · OpenStats

OpenStats Residential Mill Rates

OpenStats

Municipalities ranked by residential mill rate. Rank 1 is the highest rate. Published municipal years are used when available; gaps are interpolated or follow the provincial median path so the tax pillar moves year to year for every city.

10 editions · 2016–2025

#230
Latest · 2025 · of 343
Score 8.870787930776238

Livability

Globe and Mail Most Livable Cities

The Globe and Mail

2023 data partnership with Environics Analytics ranking 439 Canadian communities on ten livability categories.

Single edition · 2023

#57
Published · 2023 · of 439

Only one published edition places Laval in this study so far. Open the edition for method notes and the full table.

Original source · Full edition

Worth knowing in Laval

Distinctive local notes and places, each linked to its source.

  • Ville de Laval's home hero sells the place as an island: Découvrez votre île.

    Ville de Laval

  • Centre de la Nature hosts outdoor cinema and nature workshops on the municipal activity calendar.

    Ville de Laval

  • Mon Dossier is the branded citizen account gateway on laval.ca.

    Ville de Laval

  • Hospital expansion advocacy is pitched as a project ready since 2018 that still needs to move.

    Ville de Laval

Places to see

Centre de la Nature

Large municipal nature park used for summer cinema and eco programming. Lavallois treat it as the island's default green outing.

Parc Champfleury

Neighbourhood park that appears on the outdoor cinema schedule. A local alternative when Centre de la Nature feels crowded.

Pôle culturel Montmorency

Named cultural pole in the municipal culture menu. It signals that Laval keeps a dedicated arts address, not only park programming.

Follow Laval by email

When Laval moves in a ranking, posts new permit figures, or lands in a study, get a short note. A few sends a year, only when something changes.

No spam. Unsubscribe with one reply.

Related guides

More places in Quebec

All Quebec cities