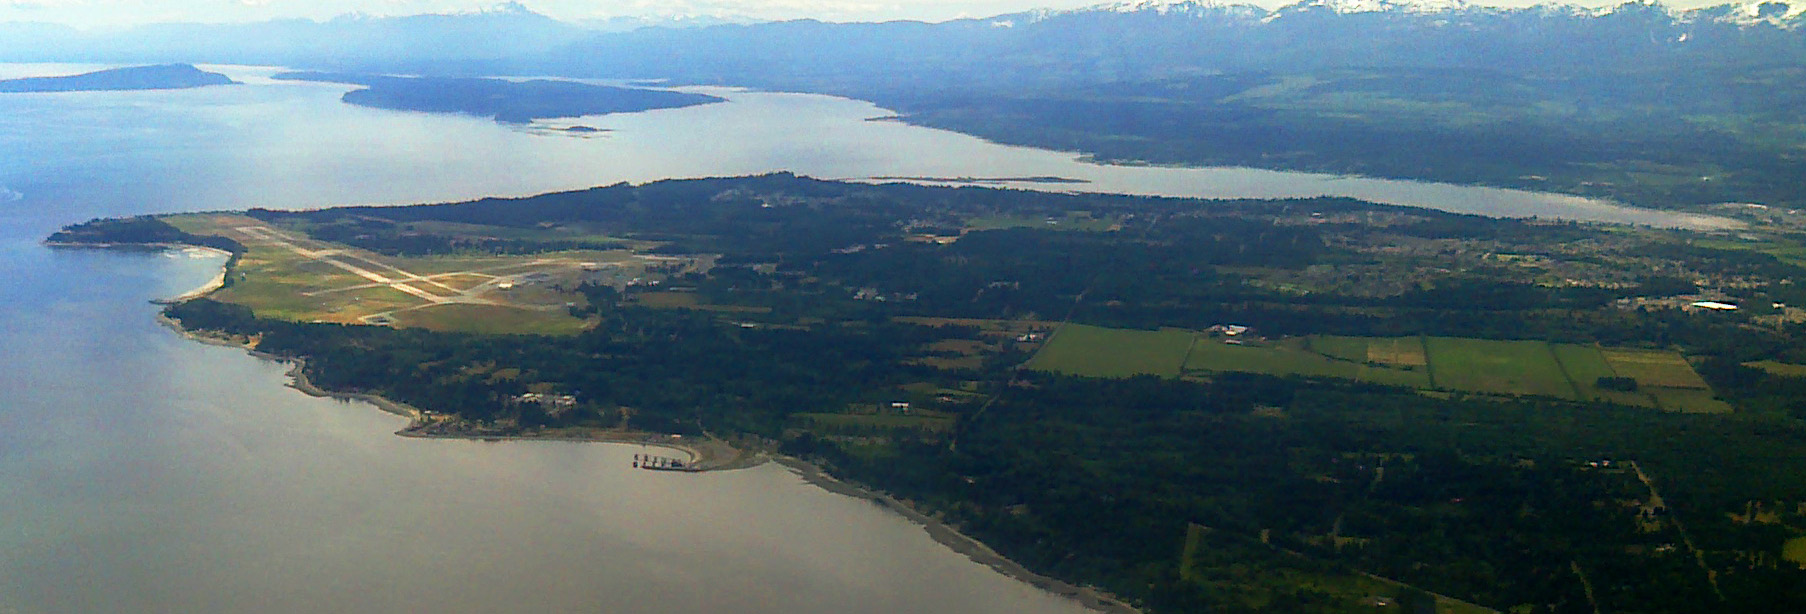
Penticton, British Columbia
Wikimedia Commons via Wikipedia

British Columbia · Civic arena

Penticton

Penticton drinking water hardness is 208 mg/L on OpenStats, plus City Score rankings and local readings.

Civic arena · hometown HUD

Penticton

Census_agglomeration47k pop
37XP
#312

#312 of 343

37% City Score XP

DirectSurface
City Score XP

7/8 pillars on the board

37%#312

Decade trail

Penticton packs 7 of eight open-data pillars into its composite standing. Tap a rival below to see how the hometown stacks up head-to-head.

Penticton drinking water

Direct municipal reading

Hardness, pH, and lead from municipal reports on the OpenStats water atlas.

Hardness
208 mg/L
very hard
pH
7.6
Lead
0 μg/L

Full Penticton water quality report →City Score rankingsCompare cities · vs Pitt Meadows · vs KamloopsHardness guide

Watershed to tap · system map

How Penticton's water works

Open full map

Source, treatment, and distribution for Penticton from municipal and provincial water records. Hardness and grade are published readings.

Local numbers for Penticton

Drinking water first, then permits, tax, internet, radon, and hazards for Penticton.

How Penticton scores

Penticton sits at City Score rank #312 with a standing of 37%, from 7 of 8 open-data pillars (tax, construction, connectivity, indoor air, water, seismic hazard, growth, safety). Missing pillars score at median standing so thin coverage cannot inflate the rank. The chart below shows how that standing moves year to year.

Latest owned placements: building permit value rank #336 of 343 (2025); indoor radon rank #94 of 343 at 208 Bq/m³ survey mean; residential mill rate rank #207 of 343 (9.37 mill rate). Full tables and method notes live on each study edition; atlas readings for the same slug open from the topic buttons.

#312
Arena rank (of 343)
37%
City Score
7
Pillars observed

Arena loadout

Topic XP bars

Arena rank #312 of 343

City Score

7/8 pillars · main XP bar

37%#312
Drinking water

Rank #112

33%
Building permits

Rank #336

2%
Internet

Rank #268

22%
Radon

Rank #94

27%
Hazards

No placement

Property tax

Rank #207

60%

Achievements

Direct municipal readingSurface water supply

Hometown notes

Archive

Earlier years: 2026 · 2025 · 2024 · 2023

Penticton in brief

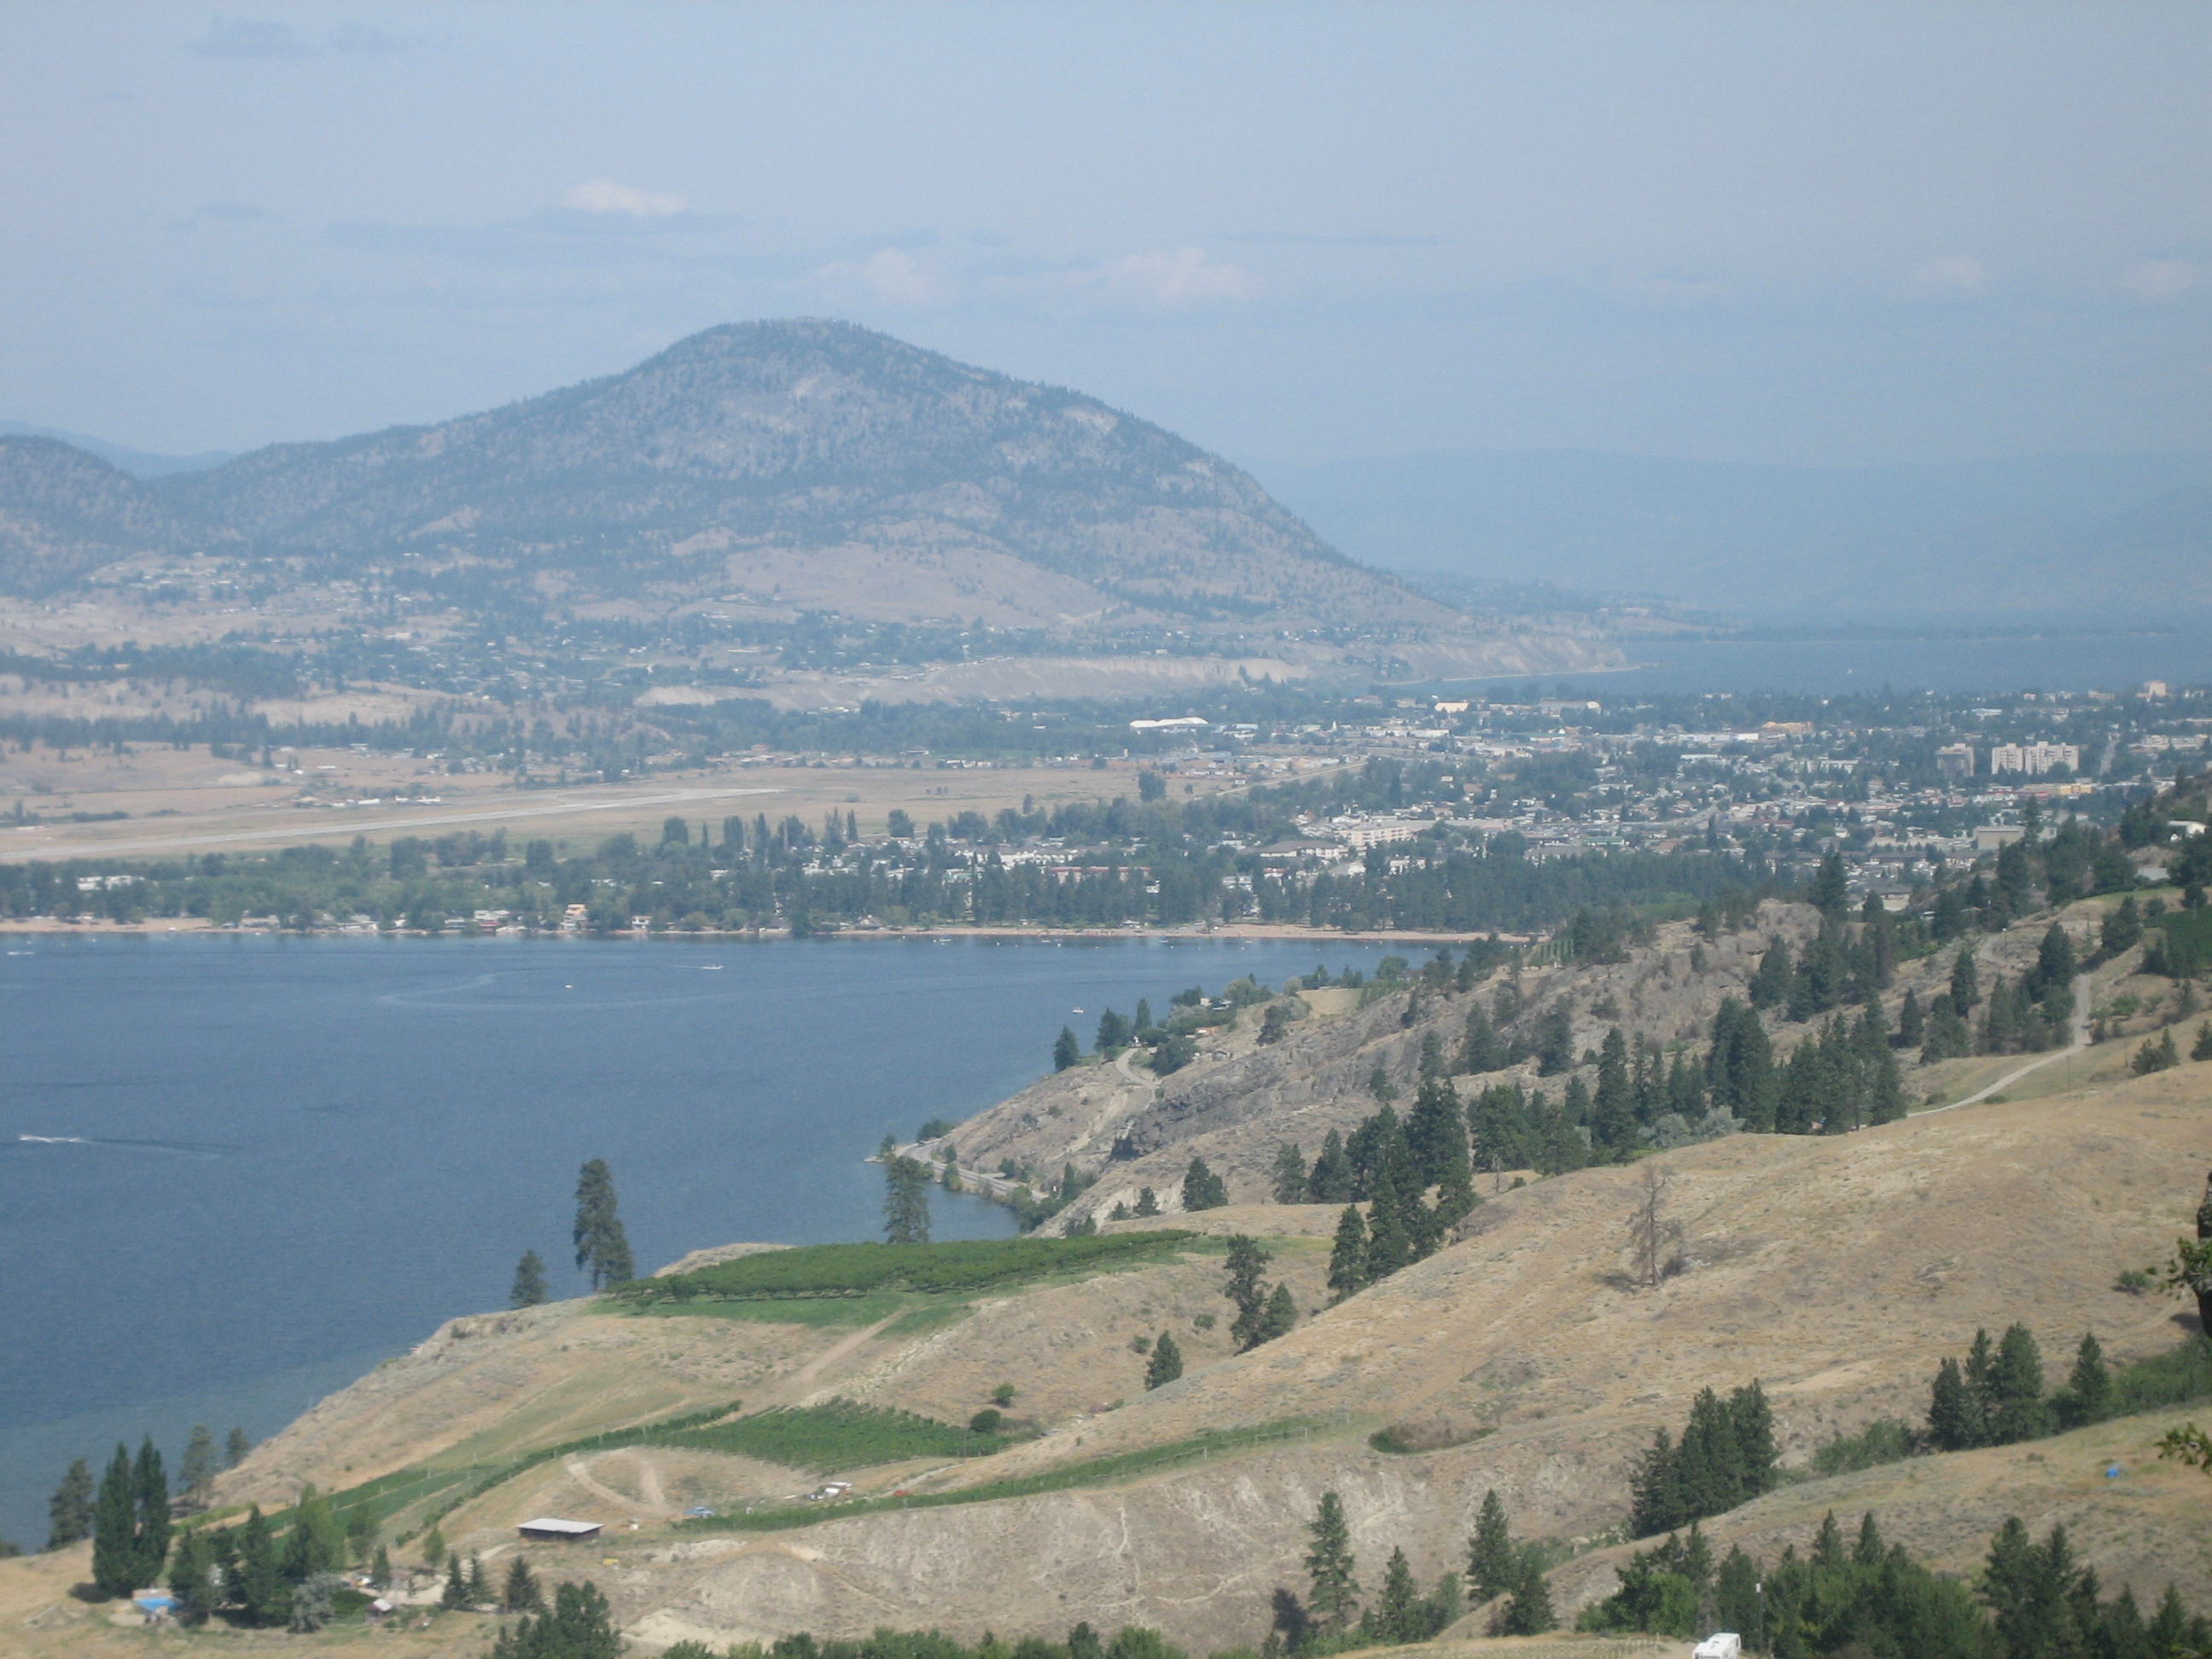
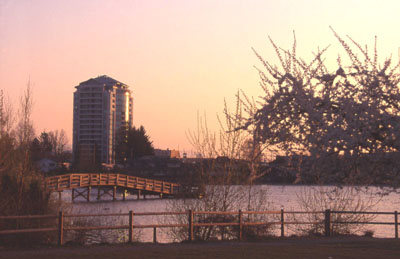
Penticton lives between two lakes. City beach pages run from Okanagan Beach and Okanagan Lake Park on the north shore to Skaha Beach and Skaha Lake Park on the south, with Marina Way, Sudbury, and Three Mile filling the local swim map. Skaha Beach gets the municipal boast about ranking among Canada's top beaches; Munson Mountain and Rotary Park handle the inland lookout and picnic half of the same weekend.

August belongs to Penticton Peach Festival. City logistics talk Lakeshore and Veterans Way, park-and-ride lots at Cherry Lane and the Seniors' Drop-In Centre, extended transit, and a free bike valet at Okanagan Lake Park while tens of thousands move through downtown. The rest of the year fills with night markets, farmers markets, and arena nights at the South Okanagan Events Centre. Cleland Community Theatre, Leir House Cultural Centre, and the Community Centre on Power Street keep arts and aquatics on the same civic campus.

Penticton Herald covers child-care expansions, affordable housing adds, and the Okanagan wildfire season that can turn the sky brown overnight. Summer utility language leans toward Stage 3 water restrictions when outdoor use stays high. Ikeda Japanese Garden, the Rose Garden, and the Youth Park skatebowl give quieter or louder alternatives to the lake edge, while McLaren Arena handles the ice calendar across town from SOEC. On OpenStats City Score for 2026, Penticton sits at rank 112 of 125. Ask for a meet-up and you will hear Skaha, Lakeshore, or Peach Fest before you hear a mall name.
Drawn from City of Penticton - Beaches, City of Penticton - Peach Festival, City of Penticton - Parks and Gardens, City of Penticton - Arts & Culture, Penticton Herald.

City Score over time

City Score from 2016–2025 across eight open-data pillars. Individual study placements are listed in the panels below.

0%25%50%75%100%2016201720182019202020212022202320242025
OpenStats City Score

Rankings for Penticton

Each study below is its own ranking. Where a study has more than one edition for this city, the chart shows standing across those years only.

Connectivity · OpenStats

OpenStats Broadband Download Speeds

OpenStats

Cities ranked by estimated best advertised download (Mbps). Anchored to the current ISED National Broadband Data vintage, then backcast along a national speed curve with city-specific fiber-arrival and 50/10 availability paths so relative ranks can change over the decade. Not a claim of audited historical hex maps for every year.

10 editions · 2016–2025

#268
Latest · 2025 · of 343
Score 216.9

Construction · OpenStats

OpenStats Building Permit Value

OpenStats

Cities ranked by calendar-year building permit value. Direct rows sum Statistics Canada Table 34-10-0292-01. Cities without a direct reading use population × provincial per-capita permit intensity (estimated), so every seed city has a year-varying construction signal.

10 editions · 2016–2025

#336
Latest · 2025 · of 343
Score 67228880

Composite · OpenStats

OpenStats City Score

OpenStats

Dimensional average of OpenStats open-data pillars for each panel year 2016–2025: tax, construction, connectivity, indoor air, water, seismic hazard, population growth, and crime severity. Each series is scored 0–1 within its edition; series in the same pillar are averaged, then all eight pillars are averaged with equal weight. Missing pillars score at median standing (0.5). Growth and CSI use StatCan annual tables; permits, mill rates, and broadband use live rows plus documented year-varying estimates where needed. Radon, water, and PGA may be survey/model vintages carried forward and are flagged when static for more than two years. External commercial livability lists are never inputs.

10 editions · 2016–2025

#312
Latest · 2025 · of 343
Score 0.37

Safety · OpenStats

OpenStats Crime Severity Index

OpenStats

Communities ranked by Statistics Canada Crime Severity Index (Table 35-10-0026-01). Rank 1 is highest CSI (worse). Values are CMA where a metro match exists, otherwise provincial CSI. Hometown pages label the grain.

10 editions · 2016–2025

#69
Latest · 2025 · of 343
Score 92.37

Water · OpenStats

OpenStats Drinking Water Hardness

OpenStats

Communities ranked by municipal drinking-water hardness (mg/L as CaCO₃). Hardness changes slowly; the atlas vintage is carried across panel years and flagged when static for more than two years.

10 editions · 2016–2025

#112
Latest · 2025 · of 343
Score 208

Health · OpenStats

OpenStats Highest Indoor Radon

OpenStats

Communities ranked by Health Canada survey mean indoor radon (Bq/m³). Rank 1 is the highest mean. Decade panel years without a new survey carry the CMA survey vintage forward; they are not annual retests.

10 editions · 2016–2025

#94
Latest · 2025 · of 343
Score 208

Growth · OpenStats

OpenStats Population Growth

OpenStats

Cities ranked by year-over-year population growth from Statistics Canada annual CSD estimates (Table 17-10-0155-01). Rank 1 is fastest growth. A few places without a clean CSD match use a provincial-path estimate anchored to seed population.

10 editions · 2016–2025

#165
Latest · 2025 · of 343
Score 0.011704992749119536

Property tax · OpenStats

OpenStats Residential Mill Rates

OpenStats

Municipalities ranked by residential mill rate. Rank 1 is the highest rate. Published municipal years are used when available; gaps are interpolated or follow the provincial median path so the tax pillar moves year to year for every city.

10 editions · 2016–2025

#207
Latest · 2025 · of 343
Score 9.366720858836473

Livability

Globe and Mail Most Livable Cities

The Globe and Mail

2023 data partnership with Environics Analytics ranking 439 Canadian communities on ten livability categories.

Single edition · 2023

#28
Published · 2023 · of 439

Only one published edition places Penticton in this study so far. Open the edition for method notes and the full table.

Original source · Full edition

Livability

Maclean's Best Communities

Maclean's

Successor-style municipal livability ranking published by Maclean's for 2019 and 2021 (no 2020 edition).

Single edition · 2021

#41
Published · 2021 · of 415

Only one published edition places Penticton in this study so far. Open the edition for method notes and the full table.

Original source · Full edition

Worth knowing in Penticton

Distinctive local notes and places, each linked to its source.

Places to see

Skaha Beach

South-end lake beach the city highlights among Canada's top beach lists. A classic sand-and-swim stop when the valley heats up.

Okanagan Lake Park

North-shore park tied to Peach Festival bike valet and lakeside summer crowds. Handy staging ground during festival week.

Munson Mountain

City park climb with valley views above the two-lake strip. A short workout when the beaches are packed.

Ikeda Japanese Garden

Named city garden for a quieter hour away from Lakeshore traffic. Pairs well with a Community Centre or Cleland Theatre evening.

Follow Penticton by email

When Penticton moves in a ranking, posts new permit figures, or lands in a study, get a short note. A few sends a year, only when something changes.

No spam. Unsubscribe with one reply.

Related guides

More places in British Columbia

All British Columbia cities