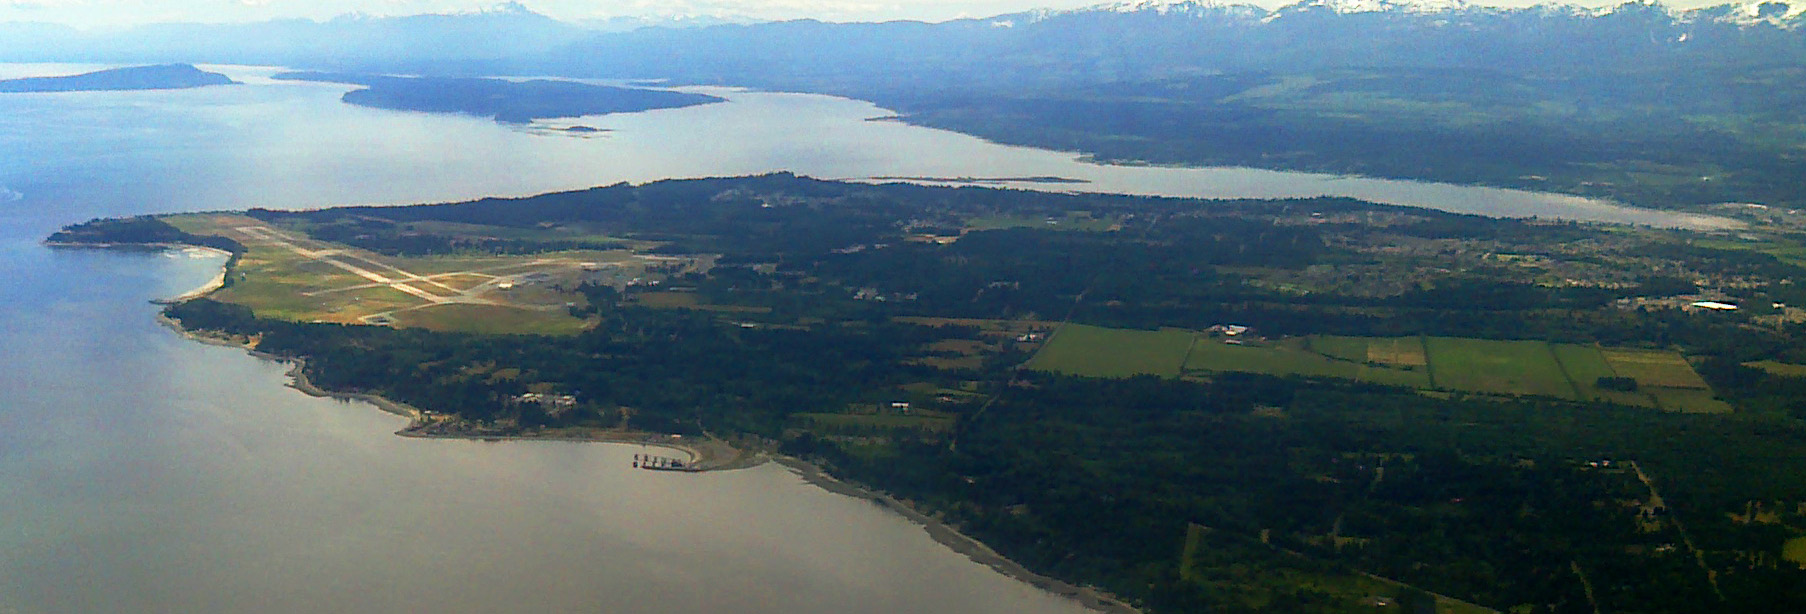
Courtenay, British Columbia
Wikimedia Commons via Wikipedia

British Columbia · Civic arena

Courtenay

Courtenay drinking water hardness is 246 mg/L on OpenStats, plus City Score rankings and local readings.

Civic arena · hometown HUD

Courtenay

Census_agglomeration63k pop
41XP
#290

#290 of 343

41% City Score XP

DroppingDirectSurface
City Score XP

7/8 pillars on the board

41%#290

Decade trail

Courtenay packs 7 of eight open-data pillars into its composite standing. Tap a rival below to see how the hometown stacks up head-to-head.

Courtenay drinking water

Direct municipal reading

Hardness, pH, and lead from municipal reports on the OpenStats water atlas.

Hardness
246 mg/L
very hard
pH
6.8999999999999995
Lead
0.6 μg/L

Full Courtenay water quality report →City Score rankingsCompare cities · vs Port Coquitlam · vs NanaimoHardness guide

Watershed to tap · system map

How Courtenay's water works

Open full map

Source, treatment, and distribution for Courtenay from municipal and provincial water records. Hardness and grade are published readings.

Local numbers for Courtenay

Drinking water first, then permits, tax, internet, radon, and hazards for Courtenay.

How Courtenay scores

Dropping13

Courtenay sits at City Score rank #290 with a standing of 41%, from 7 of 8 open-data pillars (tax, construction, connectivity, indoor air, water, seismic hazard, growth, safety). Missing pillars score at median standing so thin coverage cannot inflate the rank. Dropping 13 places versus 2022 (#277 → #290).

Latest owned placements: building permit value rank #309 of 343 (2025); indoor radon rank #188 of 343 at 146 Bq/m³ survey mean; residential mill rate rank #293 of 343 (7.83 mill rate). Full tables and method notes live on each study edition; atlas readings for the same slug open from the topic buttons.

#290
Arena rank (of 343)
41%
City Score
7
Pillars observed
Dropping13
vs 2022
#277 → #290

Arena loadout

Topic XP bars

Arena rank #290 of 343

City Score

7/8 pillars · main XP bar

41%#290
Drinking water

Rank #54

16%
Building permits

Rank #309

10%
Internet

Rank #317

8%
Radon

Rank #188

55%
Hazards

No placement

Property tax

Rank #293

85%

Achievements

Dropping -13Direct municipal readingSurface water supply

Hometown notes

Archive

Earlier years: 2026 · 2025 · 2024 · 2023

Courtenay in brief

Courtenay is the Comox Valley's largest urban centre, the place Experience Comox Valley describes when it lines Courtenay up with seaside Comox and former coal-town Cumberland. Locals talk Downtown Courtenay and the Courtenay River in the same breath. The new 6th Street Active Transportation Bridge now links 6th Street to Simms Millennium Park for walkers and cyclists, tying into the Courtenay Riverway path and giving the river a proper pedestrian crossing that is not the busy 5th Street Bridge.

Riverfront work is the civic story of the decade. Simms Summer Concerts are back on Sunday evenings at Simms Park, lawn chairs pointed at the water. Across the bank, the Anderton Riverbank Restoration is reshaping the west shore from near 5th Street toward Riverside Park, opposite the Florence Filberg Centre. Lewis Centre runs the recreation desk, Sid Williams Theatre holds the stage nights, and the Courtenay and District Museum on 4th Street keeps the Elasmosaur and fossil-tour crowd in the downtown mix. Native Sons Hall and The LINC Youth Centre round out the booking map.

East Courtenay is planning Fire Hall #2 at the Waters Place training grounds, while Bill Moore Park and Dogwood Park are in the concept-feedback queue. The Comox Valley Record covers CVRD recreation debates and Area B politics that still shape life inside city limits, including outdoor-pool talk. Stage 3 watering restrictions on the Comox Valley water system are summer background noise. The hometown tell is whether you cross at 6th Street now, whether Simms has a band this Sunday, and whether Downtown Courtenay feels like the Valley's main street.
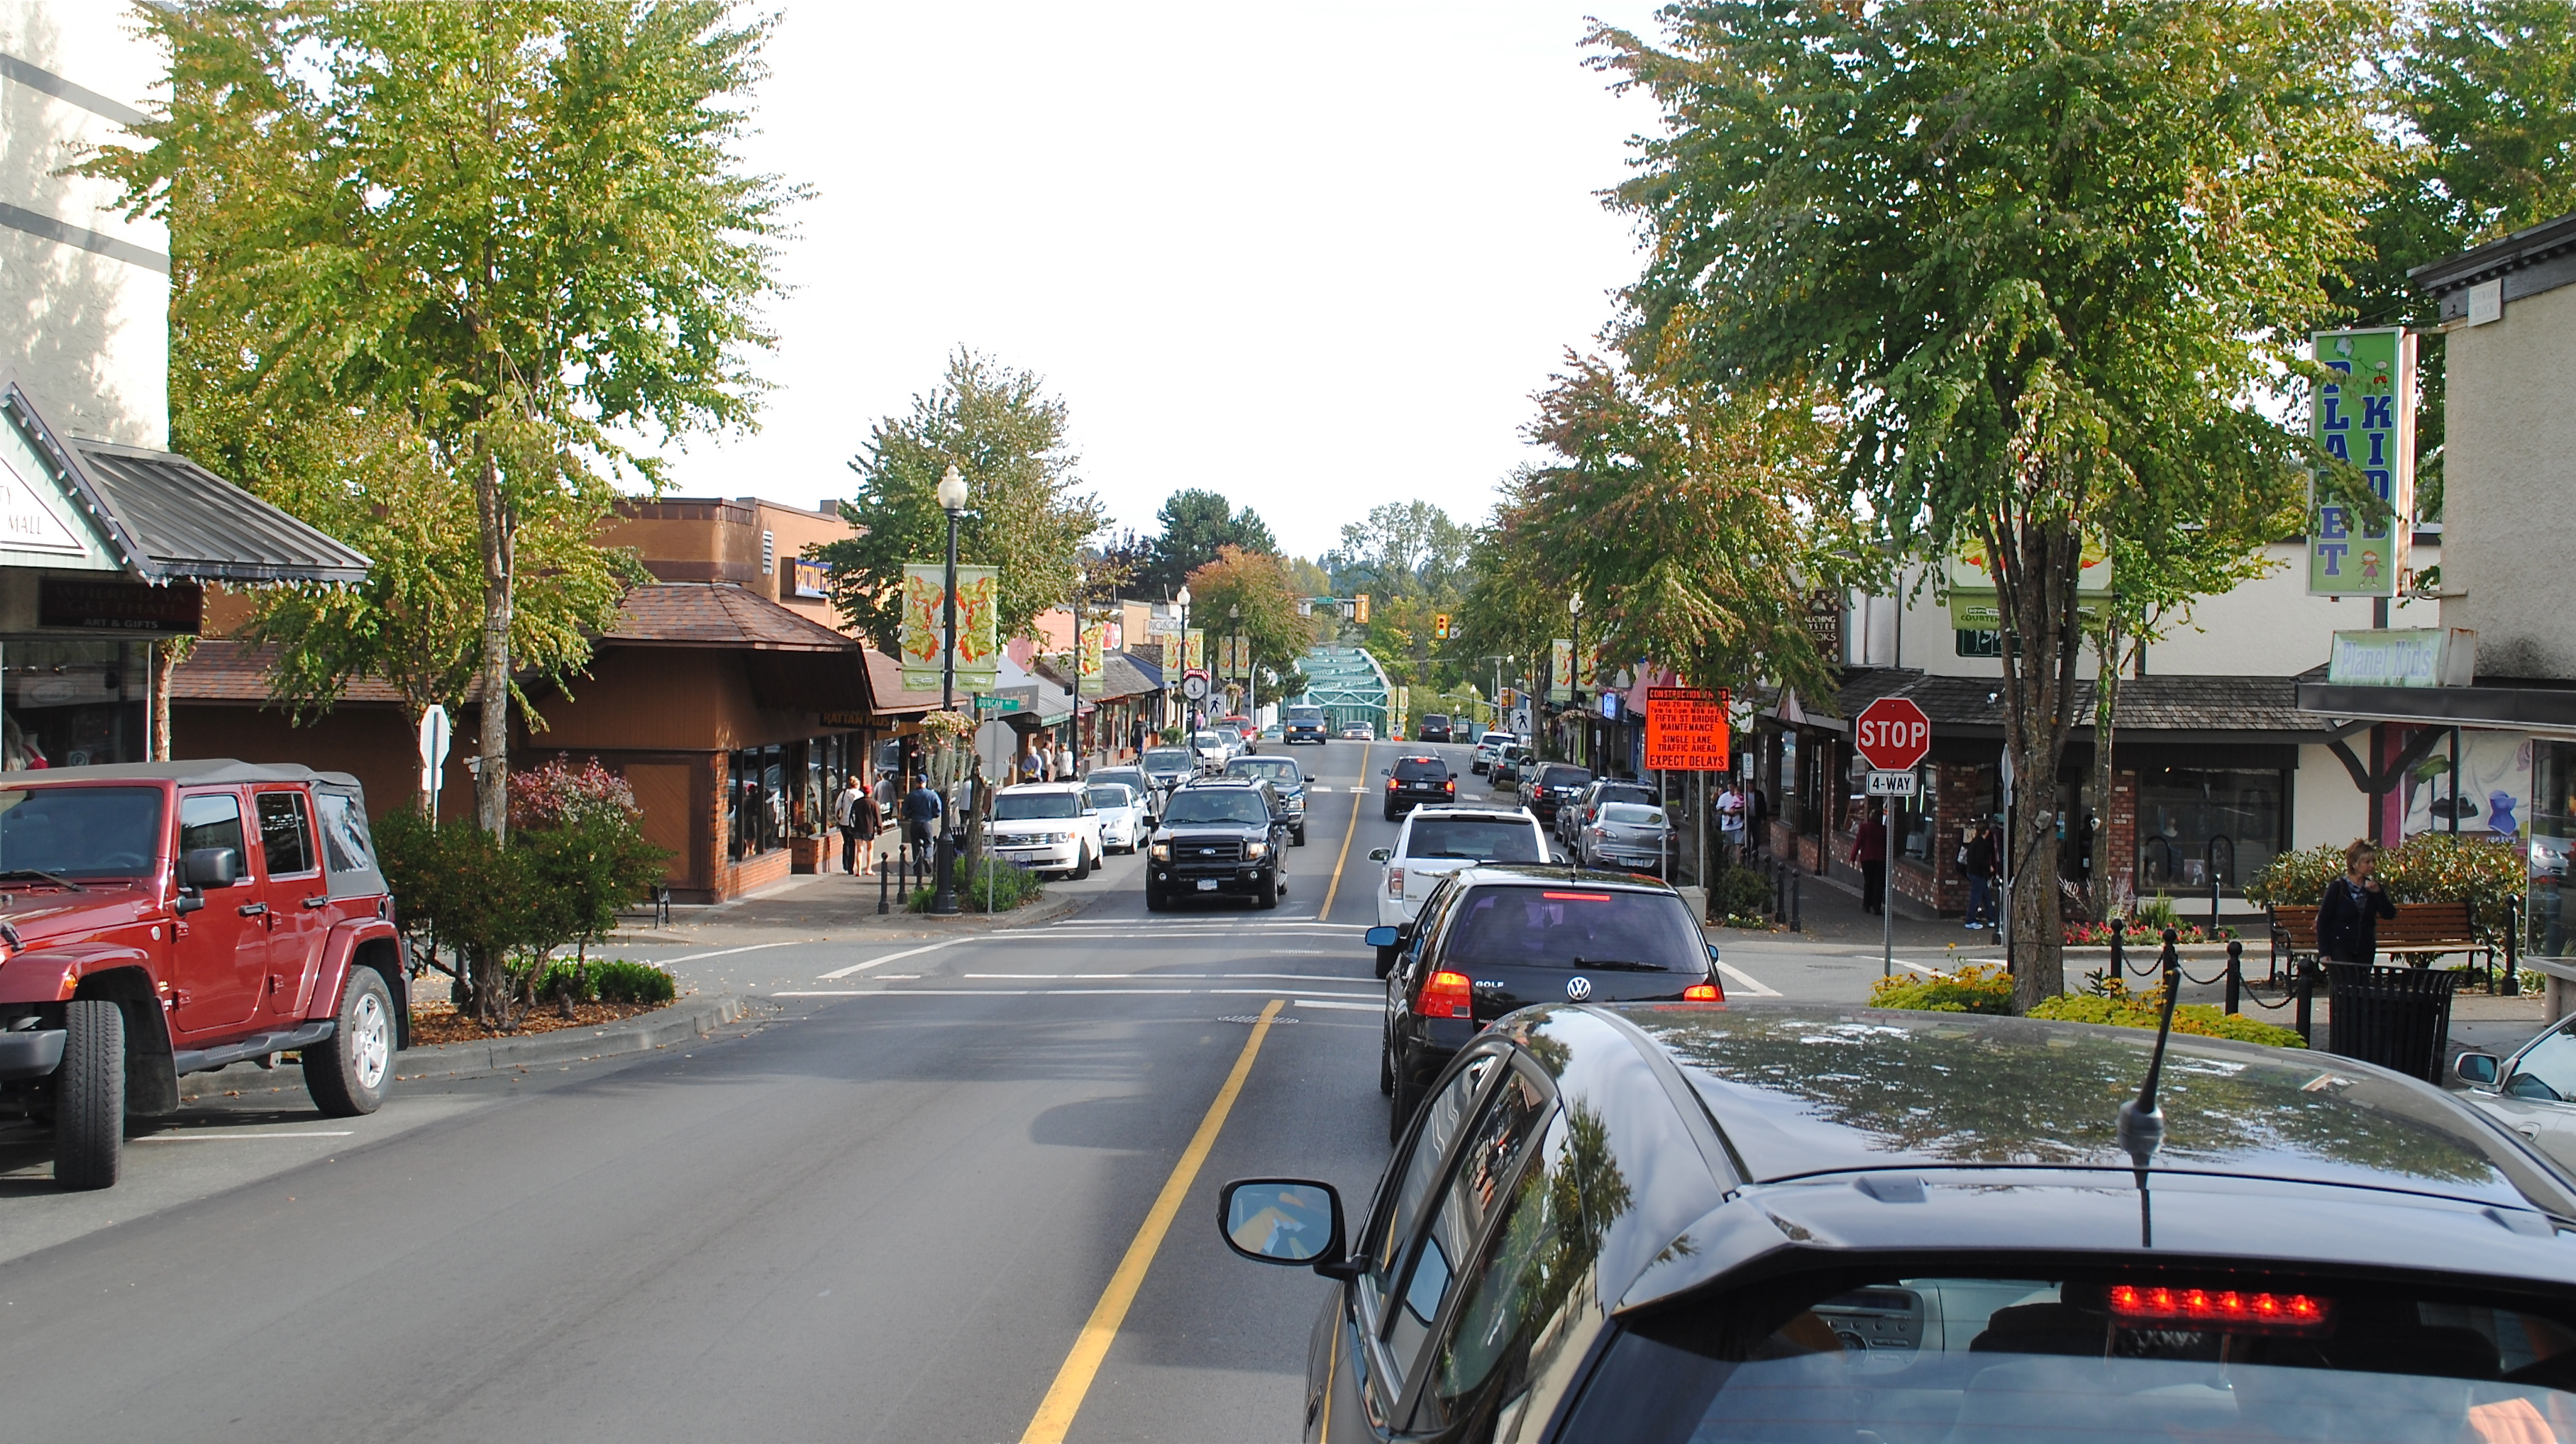
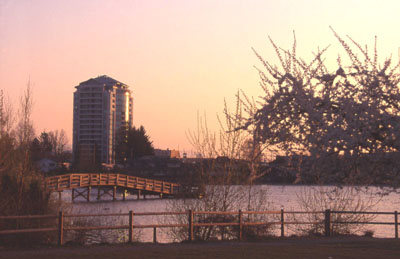
Drawn from City of Courtenay, City of Courtenay, Experience Comox Valley, Comox Valley Record.

City Score over time

City Score from 2016–2025 across eight open-data pillars. Individual study placements are listed in the panels below.

0%25%50%75%100%2016201720182019202020212022202320242025
OpenStats City Score

Rankings for Courtenay

Each study below is its own ranking. Where a study has more than one edition for this city, the chart shows standing across those years only.

Connectivity · OpenStats

OpenStats Broadband Download Speeds

OpenStats

Cities ranked by estimated best advertised download (Mbps). Anchored to the current ISED National Broadband Data vintage, then backcast along a national speed curve with city-specific fiber-arrival and 50/10 availability paths so relative ranks can change over the decade. Not a claim of audited historical hex maps for every year.

10 editions · 2016–2025

#317
Latest · 2025 · of 343
Score 122.8

Construction · OpenStats

OpenStats Building Permit Value

OpenStats

Cities ranked by calendar-year building permit value. Direct rows sum Statistics Canada Table 34-10-0292-01. Cities without a direct reading use population × provincial per-capita permit intensity (estimated), so every seed city has a year-varying construction signal.

10 editions · 2016–2025

#309
Latest · 2025 · of 343
Score 137823868

Composite · OpenStats

OpenStats City Score

OpenStats

Dimensional average of OpenStats open-data pillars for each panel year 2016–2025: tax, construction, connectivity, indoor air, water, seismic hazard, population growth, and crime severity. Each series is scored 0–1 within its edition; series in the same pillar are averaged, then all eight pillars are averaged with equal weight. Missing pillars score at median standing (0.5). Growth and CSI use StatCan annual tables; permits, mill rates, and broadband use live rows plus documented year-varying estimates where needed. Radon, water, and PGA may be survey/model vintages carried forward and are flagged when static for more than two years. External commercial livability lists are never inputs.

10 editions · 2016–2025

#290
Latest · 2025 · of 343
Score 0.406

Safety · OpenStats

OpenStats Crime Severity Index

OpenStats

Communities ranked by Statistics Canada Crime Severity Index (Table 35-10-0026-01). Rank 1 is highest CSI (worse). Values are CMA where a metro match exists, otherwise provincial CSI. Hometown pages label the grain.

10 editions · 2016–2025

#49
Latest · 2025 · of 343
Score 92.37

Water · OpenStats

OpenStats Drinking Water Hardness

OpenStats

Communities ranked by municipal drinking-water hardness (mg/L as CaCO₃). Hardness changes slowly; the atlas vintage is carried across panel years and flagged when static for more than two years.

10 editions · 2016–2025

#54
Latest · 2025 · of 343
Score 246

Health · OpenStats

OpenStats Highest Indoor Radon

OpenStats

Communities ranked by Health Canada survey mean indoor radon (Bq/m³). Rank 1 is the highest mean. Decade panel years without a new survey carry the CMA survey vintage forward; they are not annual retests.

10 editions · 2016–2025

#188
Latest · 2025 · of 343
Score 146

Growth · OpenStats

OpenStats Population Growth

OpenStats

Cities ranked by year-over-year population growth from Statistics Canada annual CSD estimates (Table 17-10-0155-01). Rank 1 is fastest growth. A few places without a clean CSD match use a provincial-path estimate anchored to seed population.

10 editions · 2016–2025

#45
Latest · 2025 · of 343
Score 0.025969972219621062

Property tax · OpenStats

OpenStats Residential Mill Rates

OpenStats

Municipalities ranked by residential mill rate. Rank 1 is the highest rate. Published municipal years are used when available; gaps are interpolated or follow the provincial median path so the tax pillar moves year to year for every city.

10 editions · 2016–2025

#293
Latest · 2025 · of 343
Score 7.833735249473397

Livability

Maclean's Best Communities

Maclean's

Successor-style municipal livability ranking published by Maclean's for 2019 and 2021 (no 2020 edition).

Single edition · 2021

#49
Published · 2021 · of 415

Only one published edition places Courtenay in this study so far. Open the edition for method notes and the full table.

Original source · Full edition

Worth knowing in Courtenay

Distinctive local notes and places, each linked to its source.

  • Tourism copy still calls Courtenay the Comox Valley's largest urban centre, which matches how Valley residents assign downtown errands.

    Experience Comox Valley

  • The 6th Street Active Transportation Bridge opened in 2026 as a four-metre cable-stayed crossing for walking and cycling to Simms Park.

    City of Courtenay

  • Anderton Riverbank Restoration runs about 320 metres along the Courtenay River opposite the Florence Filberg Centre.

    City of Courtenay

  • The Courtenay and District Museum advertises an Elasmosaur skeleton and fossil tours, a paleontology flex unusual for a mid-Island downtown.

    City of Courtenay

Places to see

Simms Millennium Park

Riverfront park at the end of the new 6th Street bridge, home to free Sunday summer concerts. Bring a chair; the Courtenay River is the backdrop.

Courtenay and District Museum

Downtown museum and palaeontology centre on 4th Street with deep-time exhibits and fossil tours. It keeps science curiosity on the same street grid as Sid Williams Theatre.

Florence Filberg Centre

Municipal recreation and culture facility facing the Anderton riverbank project. It is a landmark for finding Riverside Park from downtown.

Follow Courtenay by email

When Courtenay moves in a ranking, posts new permit figures, or lands in a study, get a short note. A few sends a year, only when something changes.

No spam. Unsubscribe with one reply.

Related guides

More places in British Columbia

All British Columbia cities