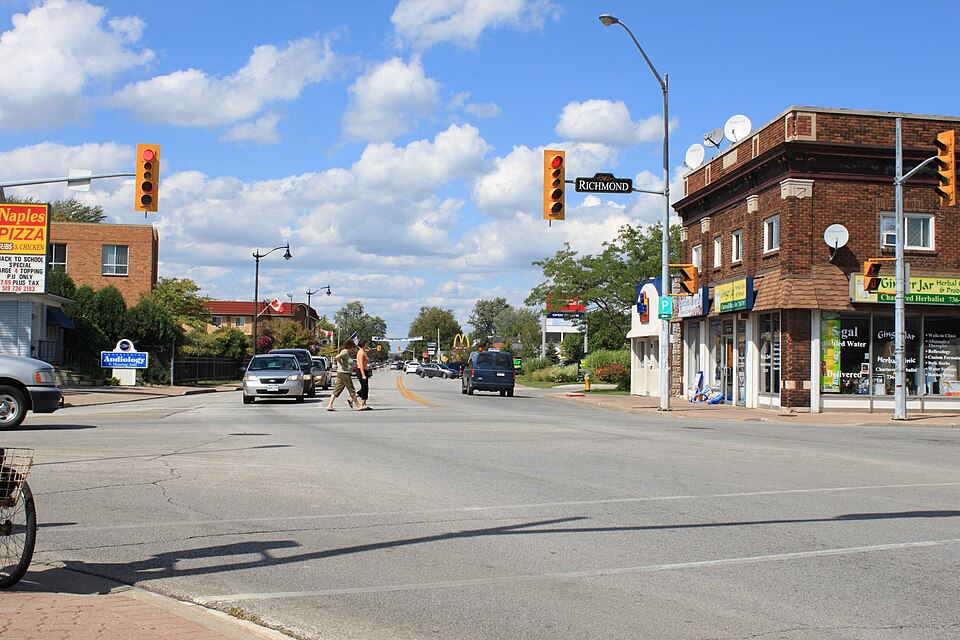
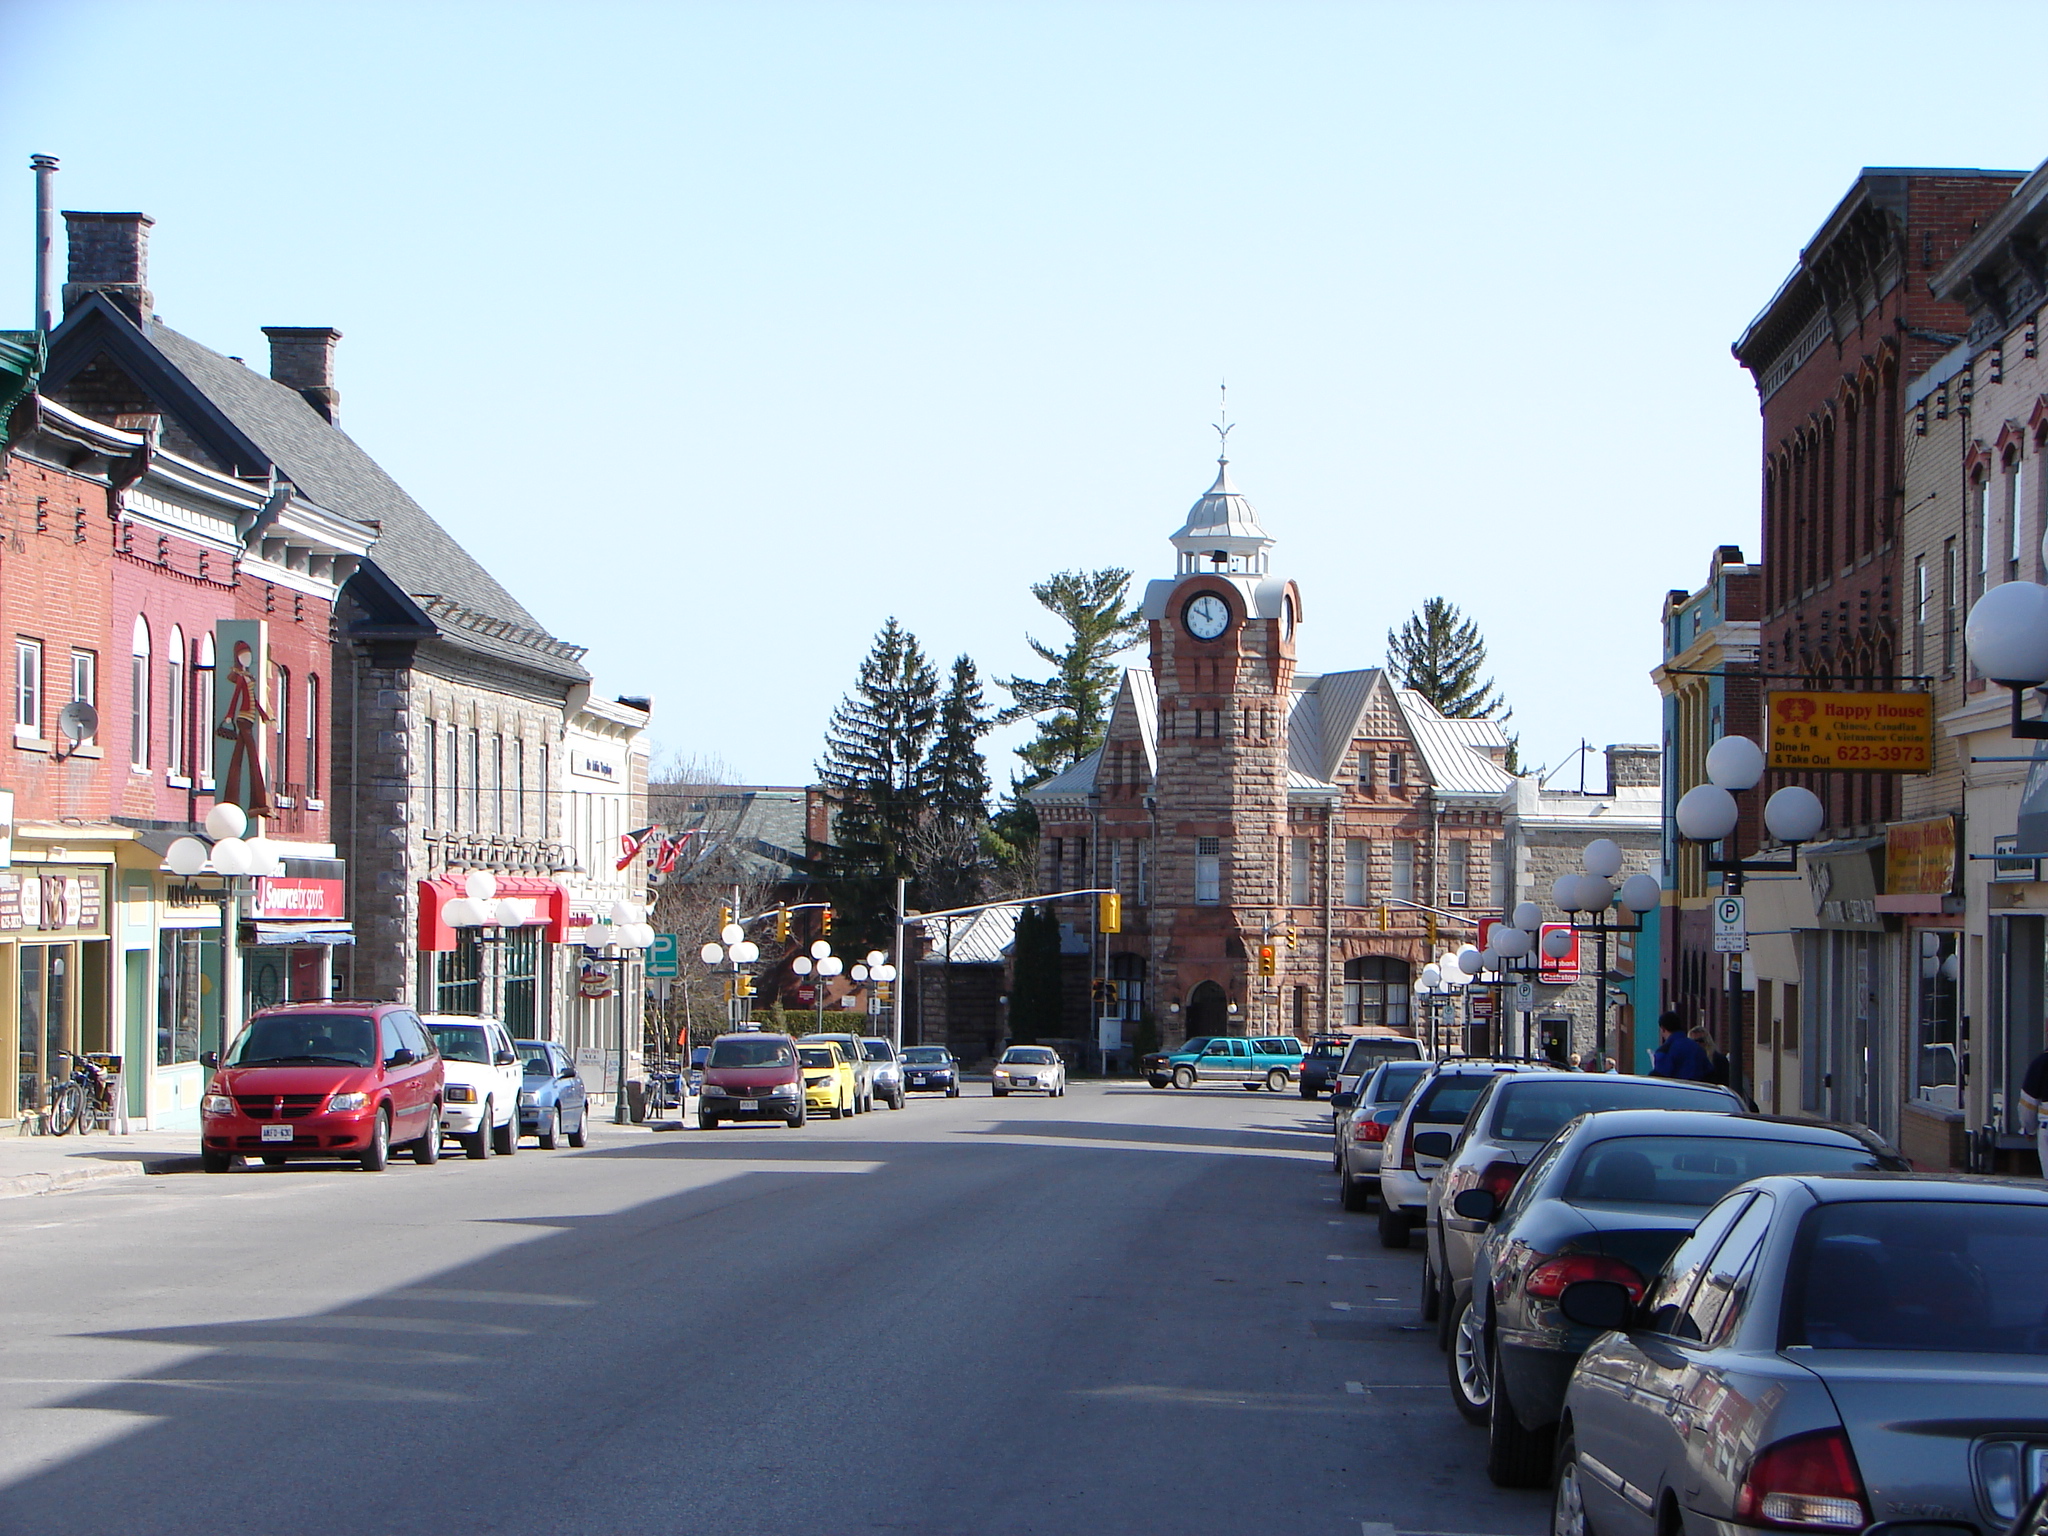
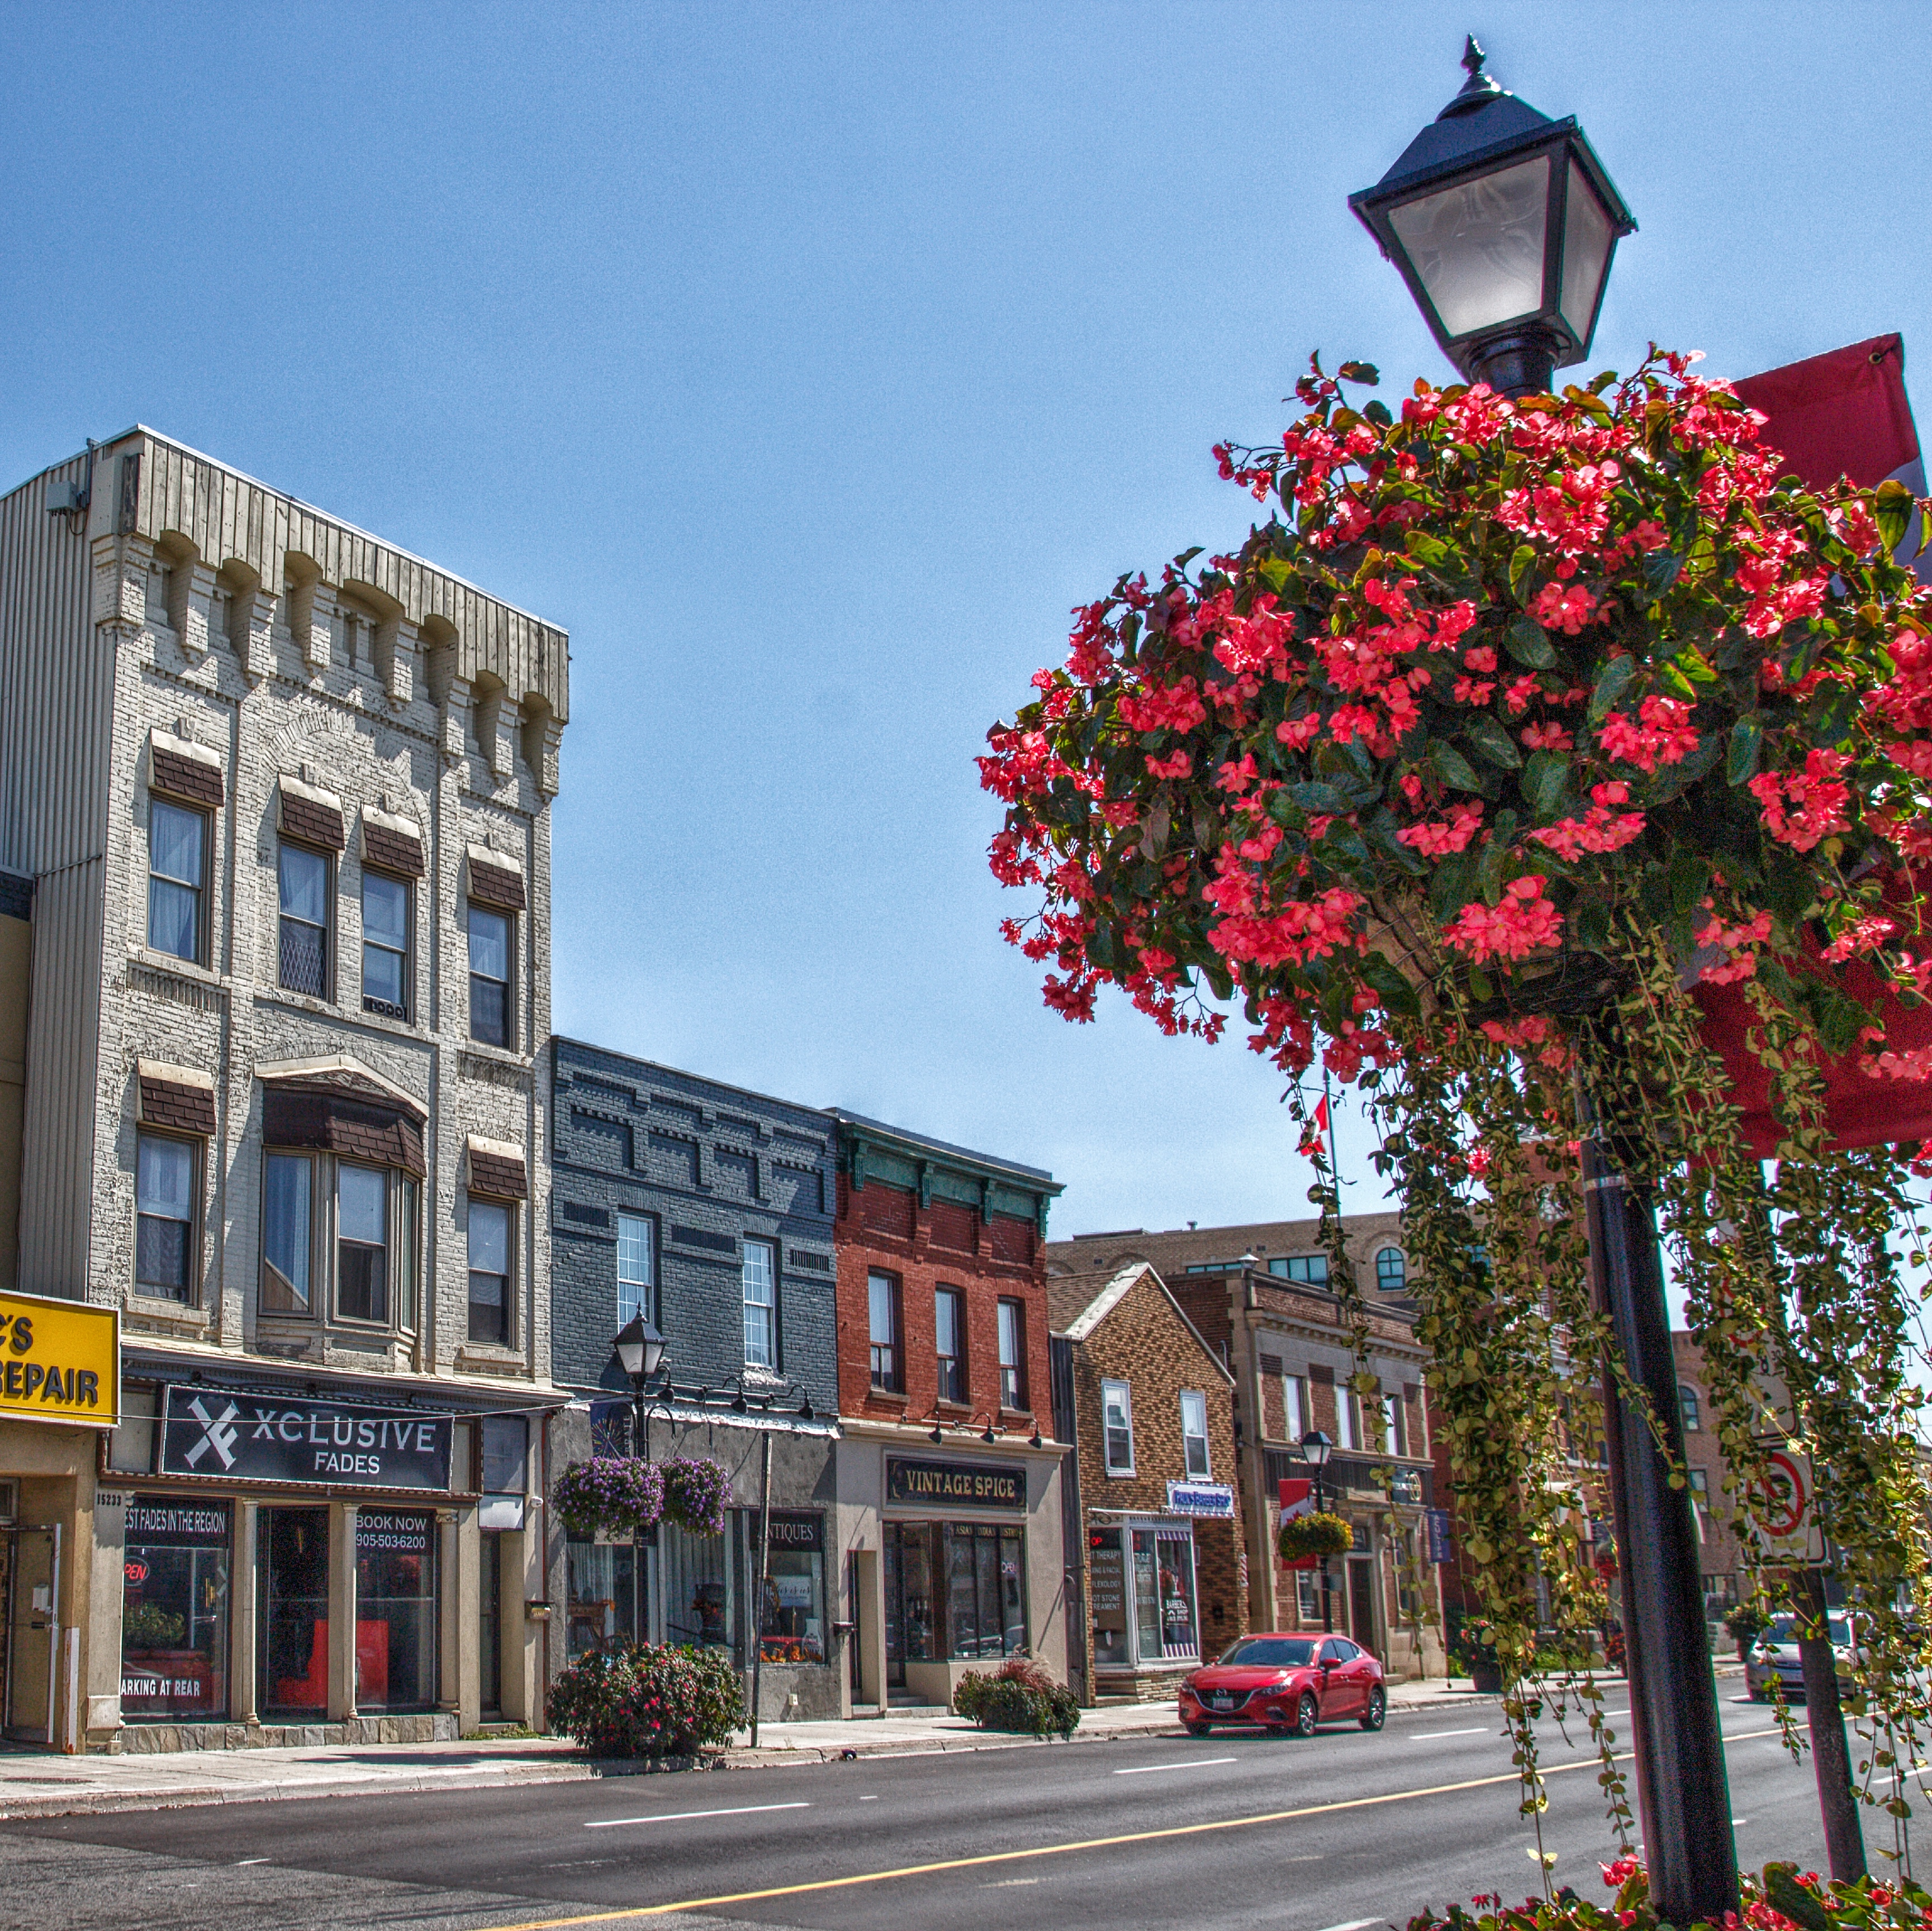
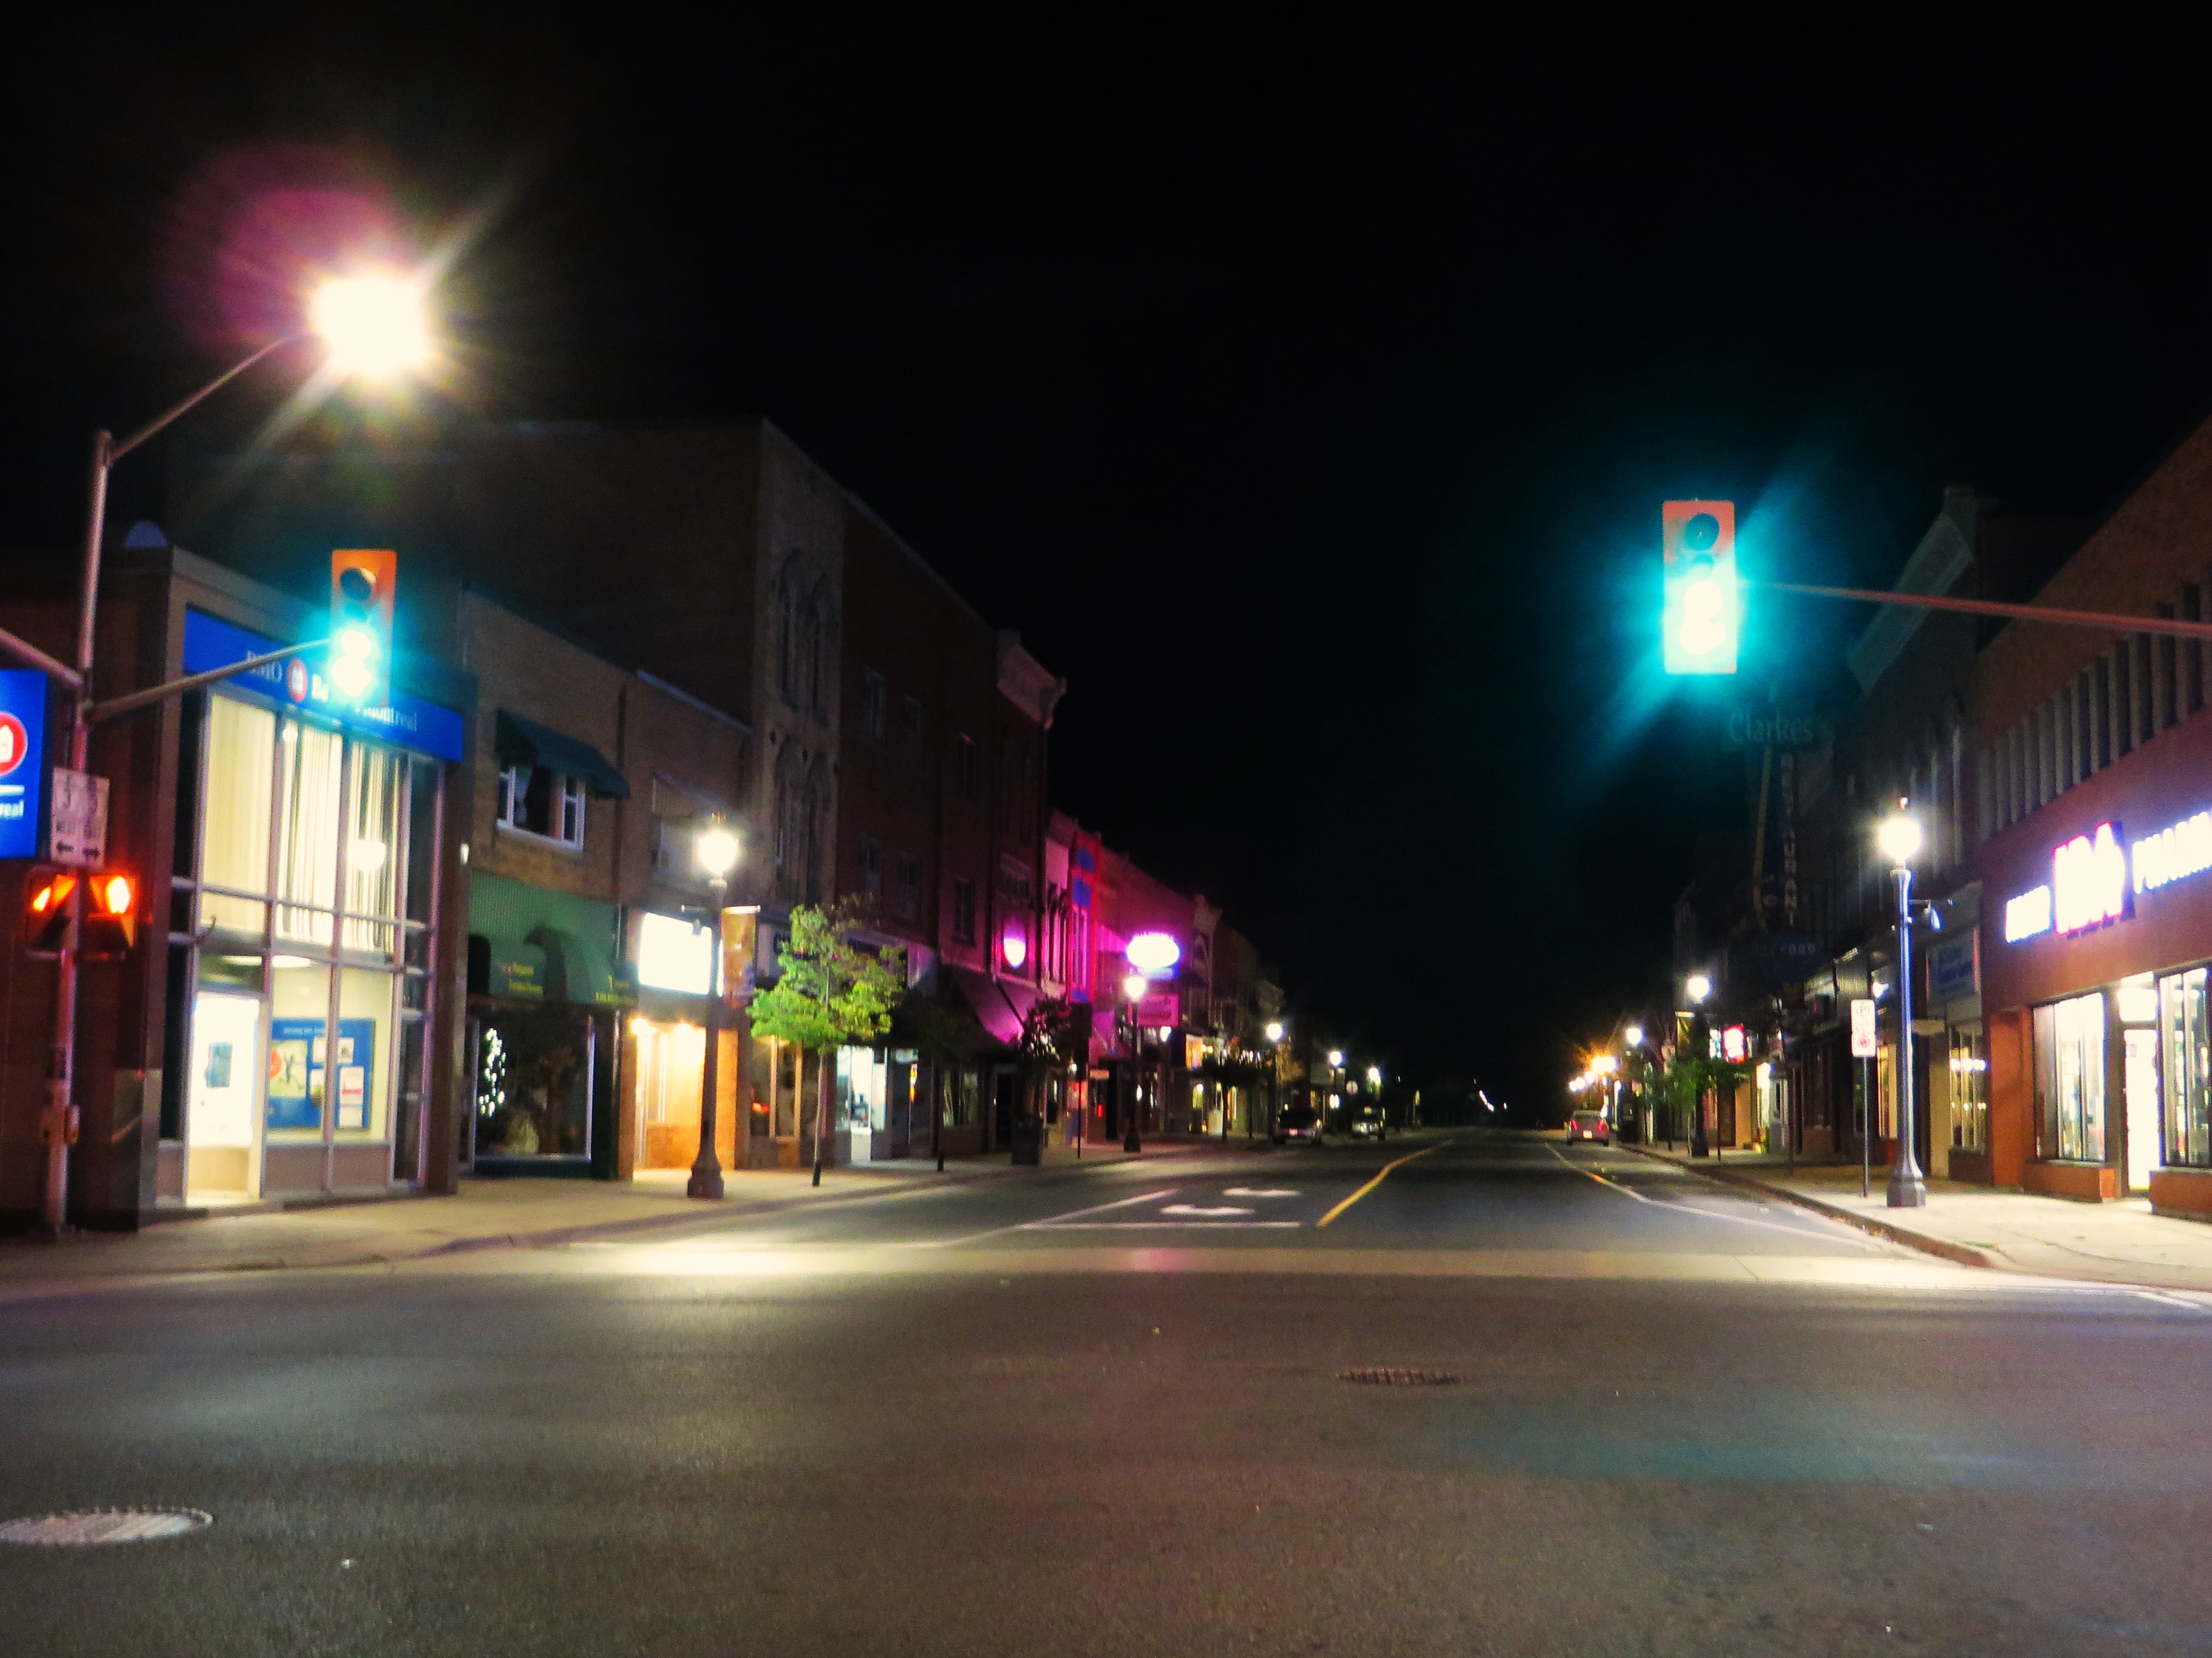
Brampton, Ontario
Wikimedia Commons via Wikipedia

Ontario · Civic arena

Brampton

Brampton drinking water hardness is 181 mg/L on OpenStats, plus City Score rankings and local readings.

Civic arena · hometown HUD

Brampton

City656k pop
36XP
#321

#321 of 343

36% City Score XP

DroppingDirectSurface
City Score XP

7/8 pillars on the board

36%#321

Decade trail

Brampton packs 7 of eight open-data pillars into its composite standing. Tap a rival below to see how the hometown stacks up head-to-head.

Brampton drinking water

Direct municipal reading

Hardness, pH, and lead from municipal reports on the OpenStats water atlas.

Hardness
181 mg/L
very hard
pH
6.8999999999999995
Lead
0.5 μg/L

Full Brampton water quality report →City Score rankingsCompare cities · vs Kitchener · vs MississaugaHardness guide

Watershed to tap · system map

How Brampton's water works

Open full map

Source, treatment, and distribution for Brampton from municipal and provincial water records. Hardness and grade are published readings.

Local numbers for Brampton

Drinking water first, then permits, tax, internet, radon, and hazards for Brampton.

How Brampton scores

Dropping67

Brampton sits at City Score rank #321 with a standing of 36%, from 7 of 8 open-data pillars (tax, construction, connectivity, indoor air, water, seismic hazard, growth, safety). Missing pillars score at median standing so thin coverage cannot inflate the rank. Dropping 67 places versus 2022 (#254 → #321).

Latest owned placements: building permit value rank #315 of 343 (2025); indoor radon rank #129 of 343 at 181 Bq/m³ survey mean; residential mill rate rank #35 of 343 (12.97 mill rate). Full tables and method notes live on each study edition; atlas readings for the same slug open from the topic buttons.

#321
Arena rank (of 343)
36%
City Score
7
Pillars observed
Dropping67
vs 2022
#254 → #321

Arena loadout

Topic XP bars

Arena rank #321 of 343

City Score

7/8 pillars · main XP bar

36%#321
Drinking water

Rank #158

46%
Building permits

Rank #315

8%
Internet

Rank #124

64%
Radon

Rank #129

38%
Hazards

No placement

Property tax

Rank #35

10%

Achievements

Dropping -67Direct municipal readingSurface water supply

Hometown notes

Archive

Earlier years: 2026 · 2025 · 2024 · 2023

Brampton in brief

Brampton calls itself Flower City with a straight face, and the logo still carries a yellow rose for the greenhouse years when Dale's nursery made Flowertown of Canada more than a slogan. Downtown still orients around Queen and Main, the four corners that City history treats as the old settlement heart. Gage Park sits a short walk away at Main and Wellington, the first municipal park and still the place for levee skates and summer gatherings. Rose Theatre Brampton and Garden Square keep the performing-arts calendar downtown, while the Brampton Farmers' Market and Movies Under the Stars fill the warmer weekends without needing a brochure voice.

Water talk here is quieter than bay towns, but the City's own identity notes name Credit River Valley and West Humber River Valley in the logo story, and the history page still remembers Etobicoke Creek floods and the diversion channel that straightened the creek after mid-century high water. Bramalea remains the planned-city name people use for the east side that joined the 1974 boundaries. Carabram and the Flower City Parade are the festival shorthand for a Peel city that grew fast and kept cultural weekends on the civic calendar. Guardian fronts lean on Peel election turnout, police funding, and auto-theft maps; City news adds Civic Holiday hours and Hockey Night in Brampton when the rink calendar fills.

On the OpenStats City Score for 2026, Brampton sits at rank 17 of 125. Rankings aside, the hometown read is roses in the brand, four corners on the map, and Gage Park when you need a downtown green.
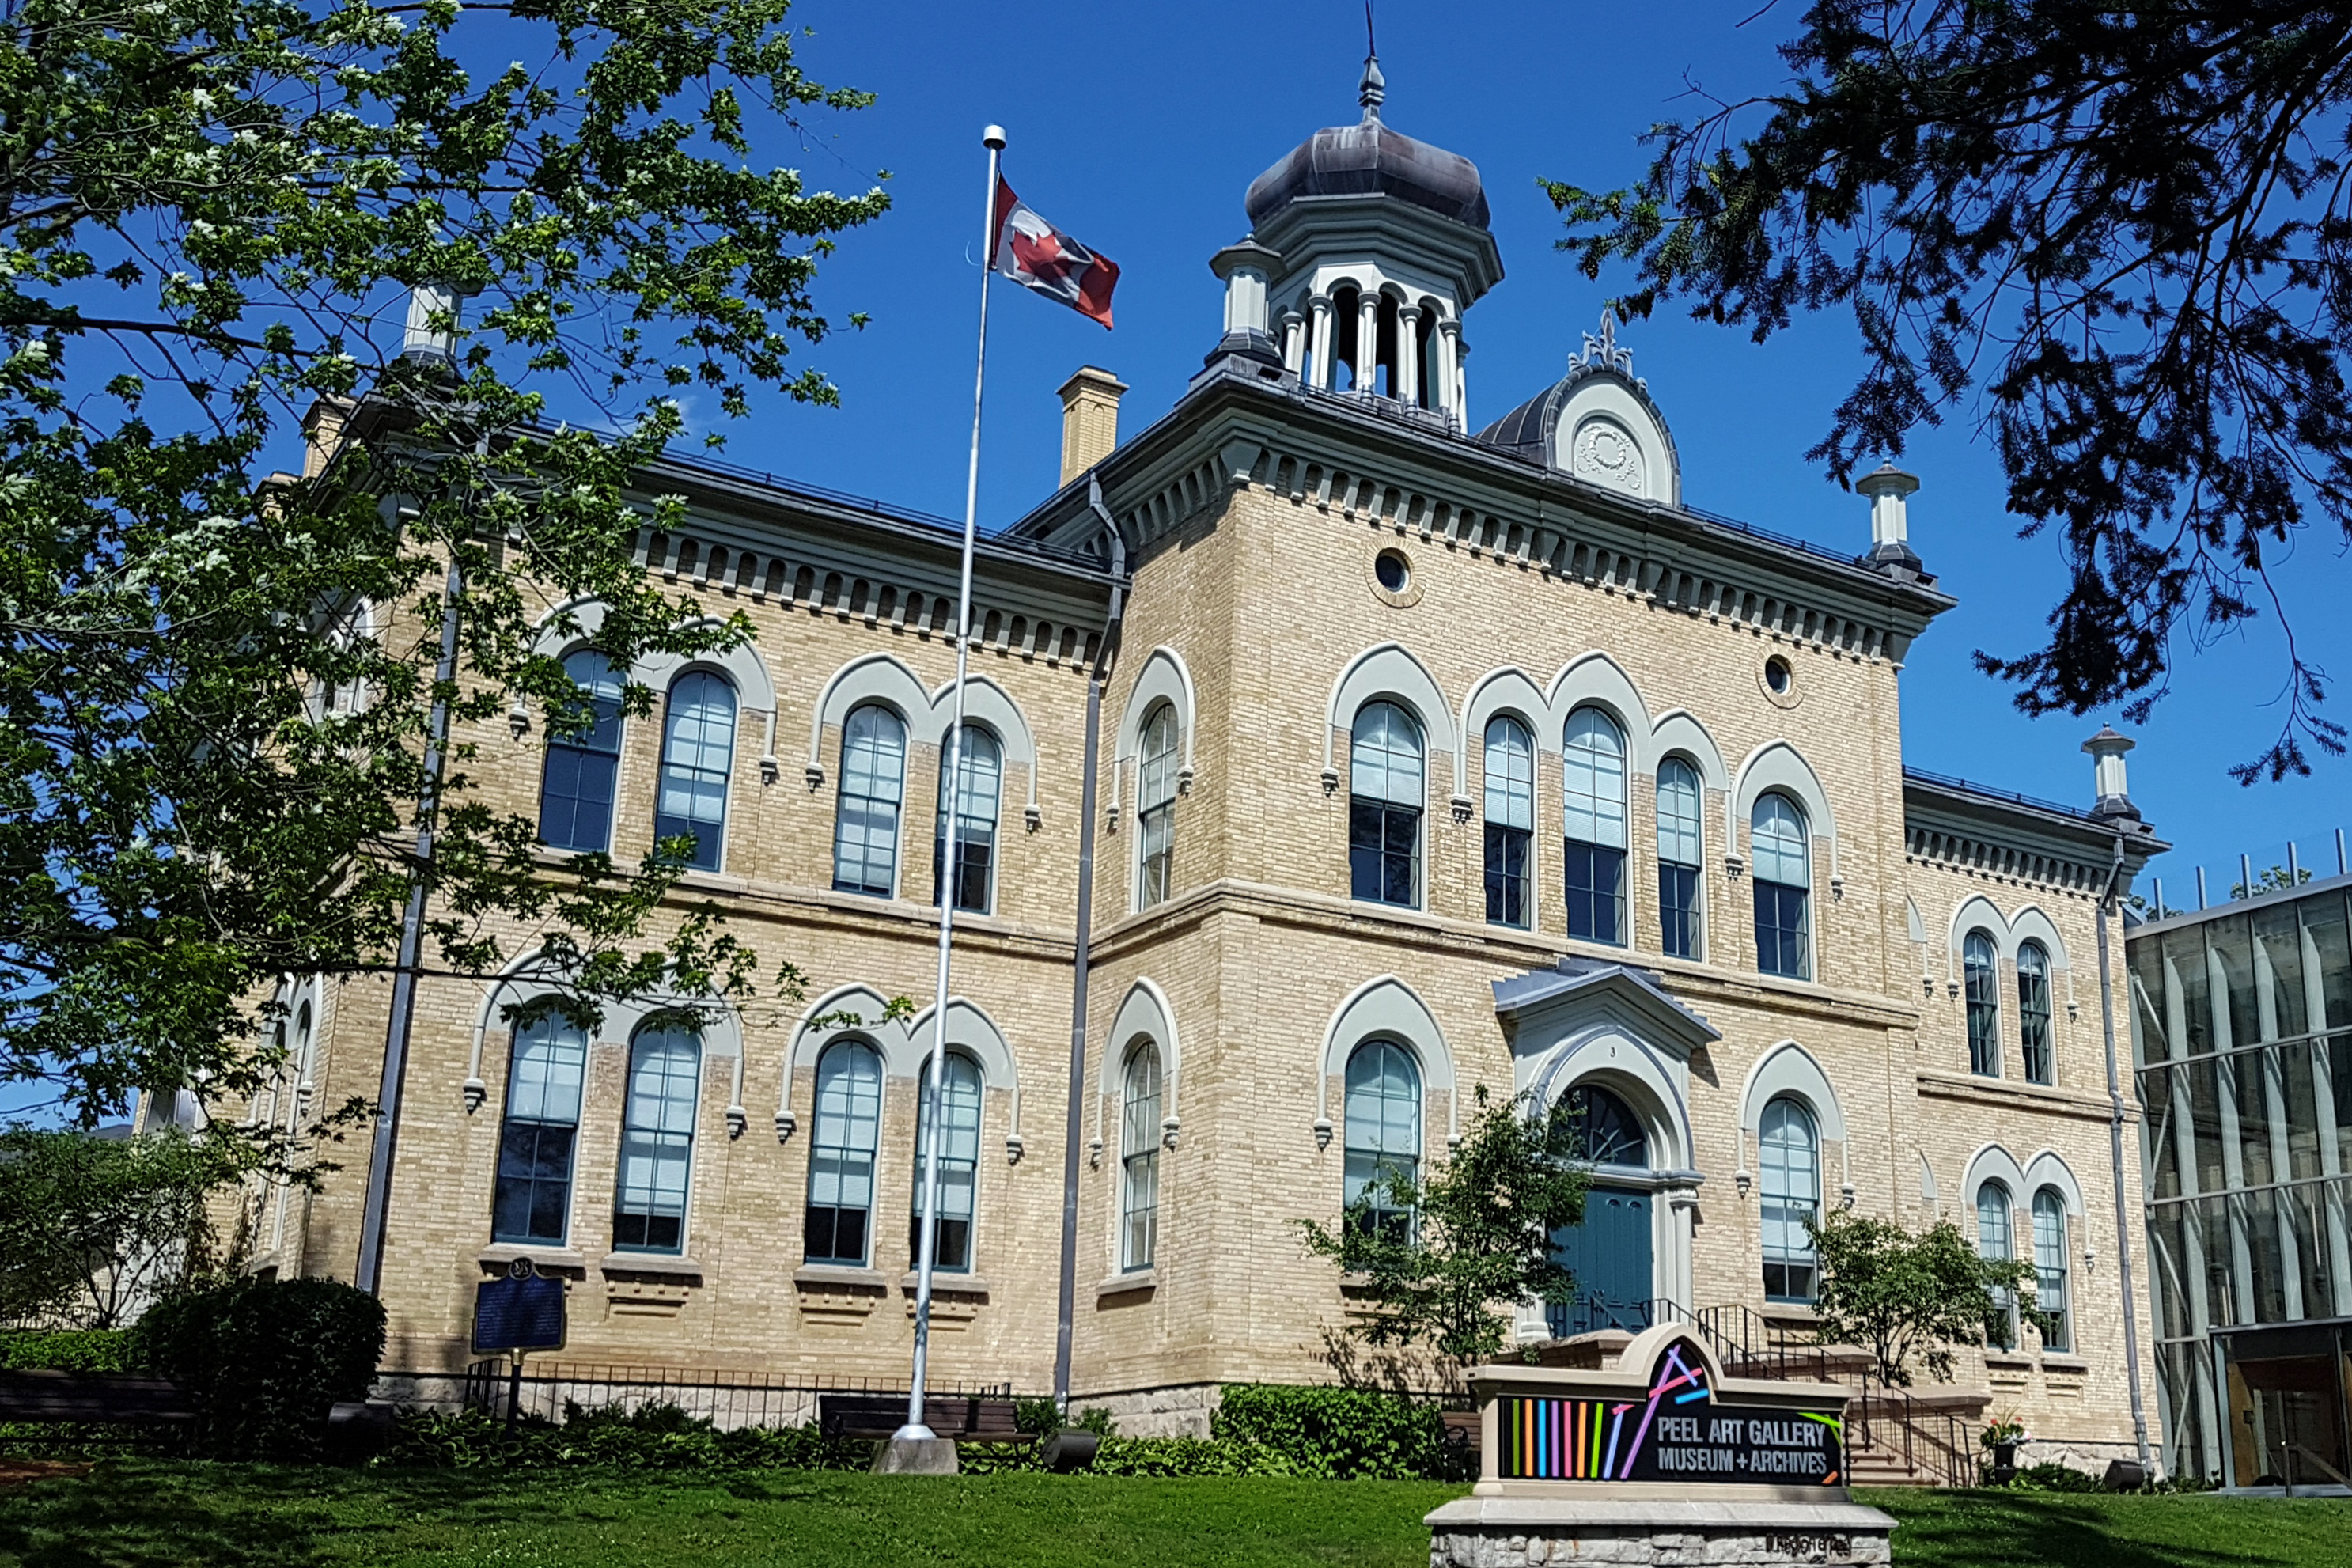
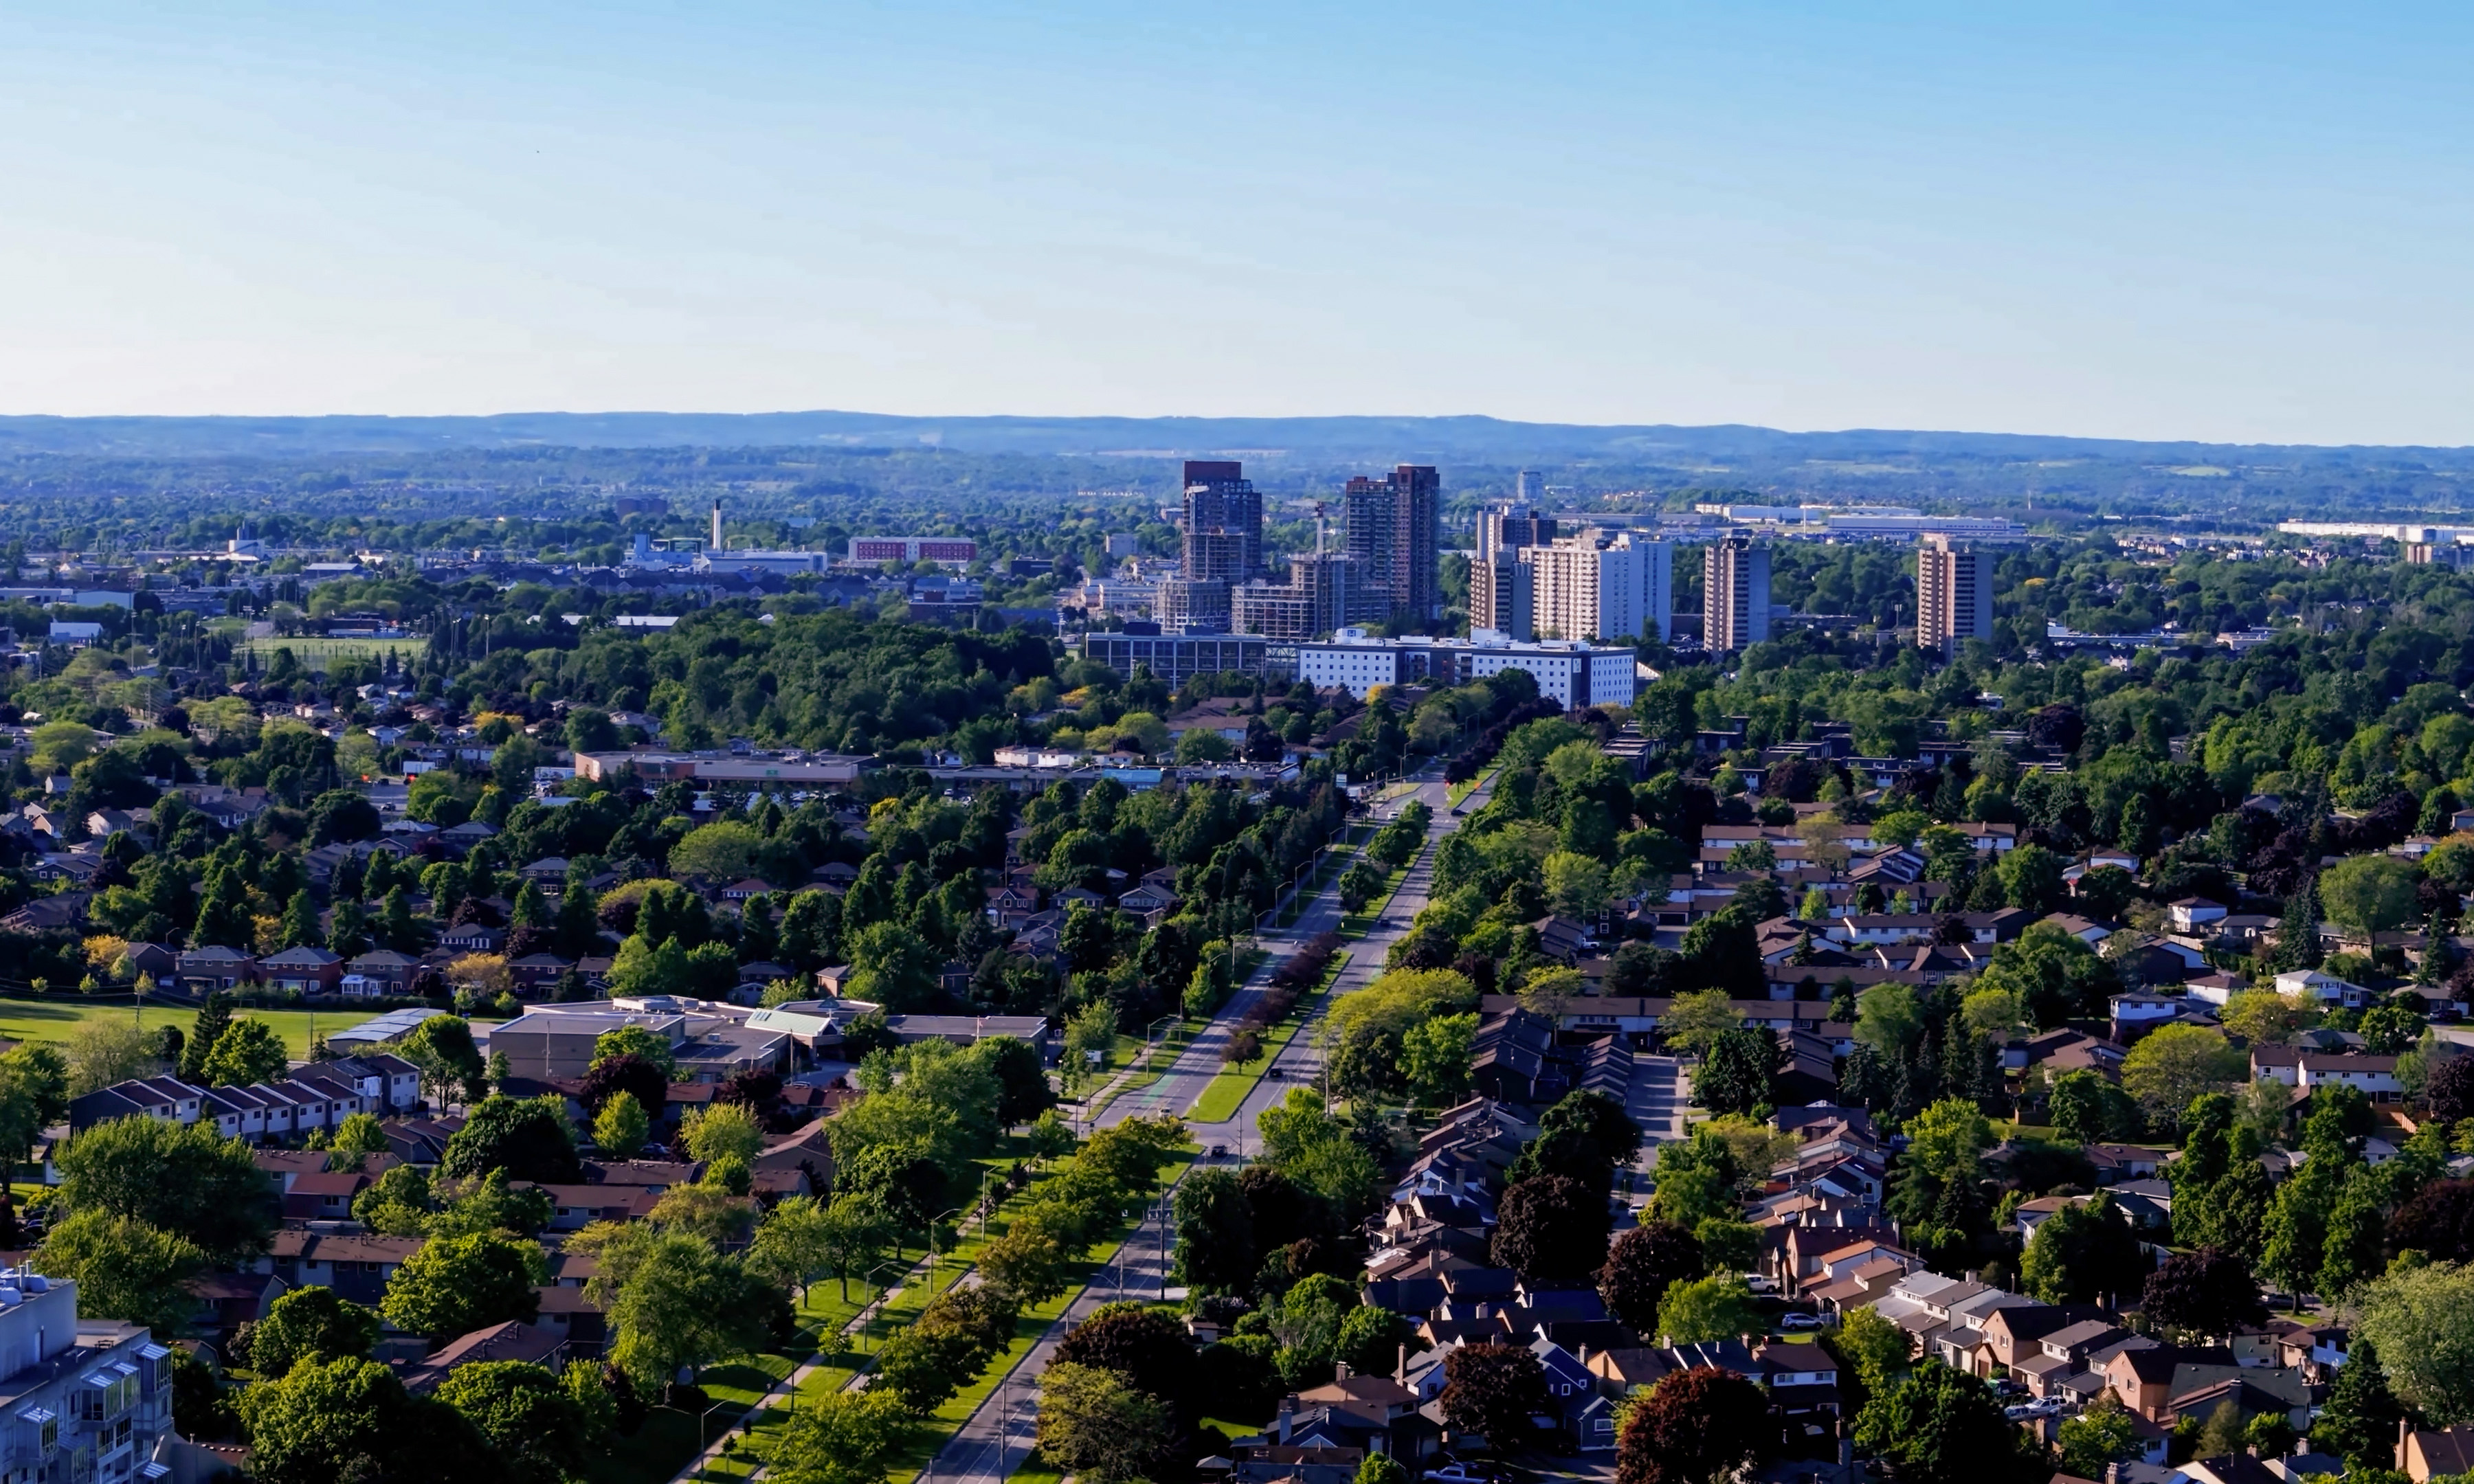
Drawn from City of Brampton corporate identity, City of Brampton history, Gage Park, City of Brampton, Brampton Guardian.

City Score over time

City Score from 2016–2025 across eight open-data pillars. Individual study placements are listed in the panels below.

0%25%50%75%100%2016201720182019202020212022202320242025
OpenStats City Score

Rankings for Brampton

Each study below is its own ranking. Where a study has more than one edition for this city, the chart shows standing across those years only.

Connectivity · OpenStats

OpenStats Broadband Download Speeds

OpenStats

Cities ranked by estimated best advertised download (Mbps). Anchored to the current ISED National Broadband Data vintage, then backcast along a national speed curve with city-specific fiber-arrival and 50/10 availability paths so relative ranks can change over the decade. Not a claim of audited historical hex maps for every year.

10 editions · 2016–2025

#124
Latest · 2025 · of 343
Score 503.7

Construction · OpenStats

OpenStats Building Permit Value

OpenStats

Cities ranked by calendar-year building permit value. Direct rows sum Statistics Canada Table 34-10-0292-01. Cities without a direct reading use population × provincial per-capita permit intensity (estimated), so every seed city has a year-varying construction signal.

10 editions · 2016–2025

#315
Latest · 2025 · of 343
Score 130965783

Composite · OpenStats

OpenStats City Score

OpenStats

Dimensional average of OpenStats open-data pillars for each panel year 2016–2025: tax, construction, connectivity, indoor air, water, seismic hazard, population growth, and crime severity. Each series is scored 0–1 within its edition; series in the same pillar are averaged, then all eight pillars are averaged with equal weight. Missing pillars score at median standing (0.5). Growth and CSI use StatCan annual tables; permits, mill rates, and broadband use live rows plus documented year-varying estimates where needed. Radon, water, and PGA may be survey/model vintages carried forward and are flagged when static for more than two years. External commercial livability lists are never inputs.

10 editions · 2016–2025

#321
Latest · 2025 · of 343
Score 0.357

Safety · OpenStats

OpenStats Crime Severity Index

OpenStats

Communities ranked by Statistics Canada Crime Severity Index (Table 35-10-0026-01). Rank 1 is highest CSI (worse). Values are CMA where a metro match exists, otherwise provincial CSI. Hometown pages label the grain.

10 editions · 2016–2025

#241
Latest · 2025 · of 343
Score 57.17

Water · OpenStats

OpenStats Drinking Water Hardness

OpenStats

Communities ranked by municipal drinking-water hardness (mg/L as CaCO₃). Hardness changes slowly; the atlas vintage is carried across panel years and flagged when static for more than two years.

10 editions · 2016–2025

#158
Latest · 2025 · of 343
Score 181

Health · OpenStats

OpenStats Highest Indoor Radon

OpenStats

Communities ranked by Health Canada survey mean indoor radon (Bq/m³). Rank 1 is the highest mean. Decade panel years without a new survey carry the CMA survey vintage forward; they are not annual retests.

10 editions · 2016–2025

#129
Latest · 2025 · of 343
Score 181

Growth · OpenStats

OpenStats Population Growth

OpenStats

Cities ranked by year-over-year population growth from Statistics Canada annual CSD estimates (Table 17-10-0155-01). Rank 1 is fastest growth. A few places without a clean CSD match use a provincial-path estimate anchored to seed population.

10 editions · 2016–2025

#325
Latest · 2025 · of 343
Score -0.007429991283606927

Property tax · OpenStats

OpenStats Residential Mill Rates

OpenStats

Municipalities ranked by residential mill rate. Rank 1 is the highest rate. Published municipal years are used when available; gaps are interpolated or follow the provincial median path so the tax pillar moves year to year for every city.

10 editions · 2016–2025

#35
Latest · 2025 · of 343
Score 12.966651902709973

Quality of life

Numbeo Quality of Life Index by City

Numbeo

Crowd-sourced composite Quality of Life Index. Historical snapshots are free on Numbeo ranking pages; OpenStats cites Canadian cities from those public pages (cite_only). Higher index scores are better; ranks are global position on the snapshot page.

Single edition · 2026

#170
Published · 2026 · of 304
Score 157.8

Only one published edition places Brampton in this study so far. Open the edition for method notes and the full table.

Original source · Full edition

Worth knowing in Brampton

Distinctive local notes and places, each linked to its source.

  • City corporate identity still ties the yellow-rose logo to Flower City and the Credit and West Humber river valleys.

    City of Brampton

  • Gage Park, at Main Street South and Wellington Street West, is listed as Brampton's first municipal park.

    City of Brampton

  • City history dates Carabram to 1982 and Rose Theatre Brampton's opening to 2006.

    City of Brampton

  • Brampton Guardian coverage regularly frames local politics inside the Region of Peel, from elections to police funding.

    Brampton Guardian

Places to see

Gage Park

Downtown's original municipal park on Main Street South. It is the green square people use when City Hall events spill outdoors and the four corners feel too paved.

Rose Theatre Brampton

The downtown performing arts house that opened in 2006 and still anchors Brampton On Stage programming. Locals treat it as the night-out landmark next to Garden Square.

Queen and Main

The four corners intersection City history calls the settlement's long-standing heart. Even after Peel-scale growth, directions still start here.

Follow Brampton by email

When Brampton moves in a ranking, posts new permit figures, or lands in a study, get a short note. A few sends a year, only when something changes.

No spam. Unsubscribe with one reply.

Related guides

More places in Ontario

All Ontario cities