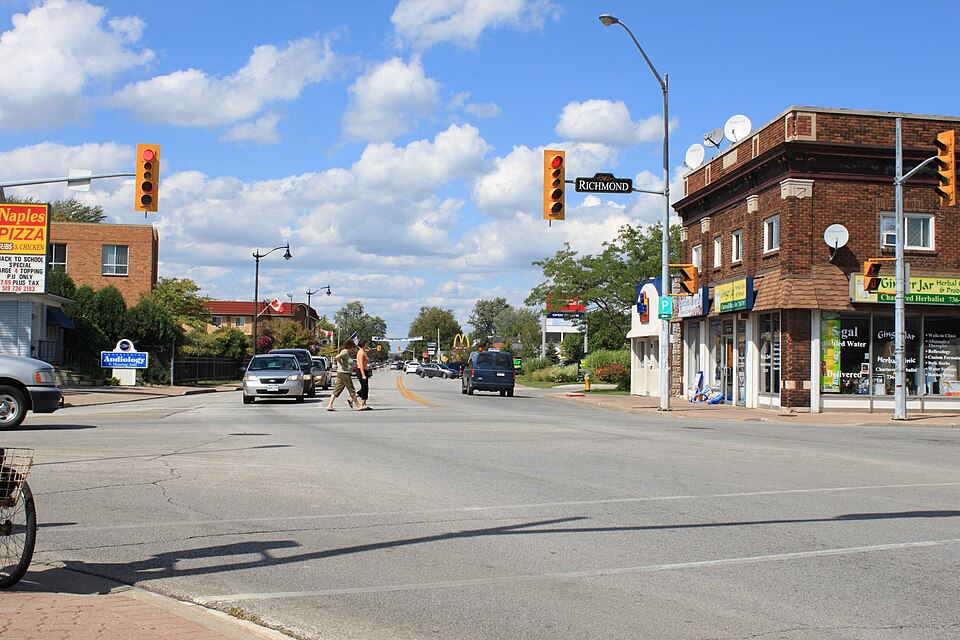
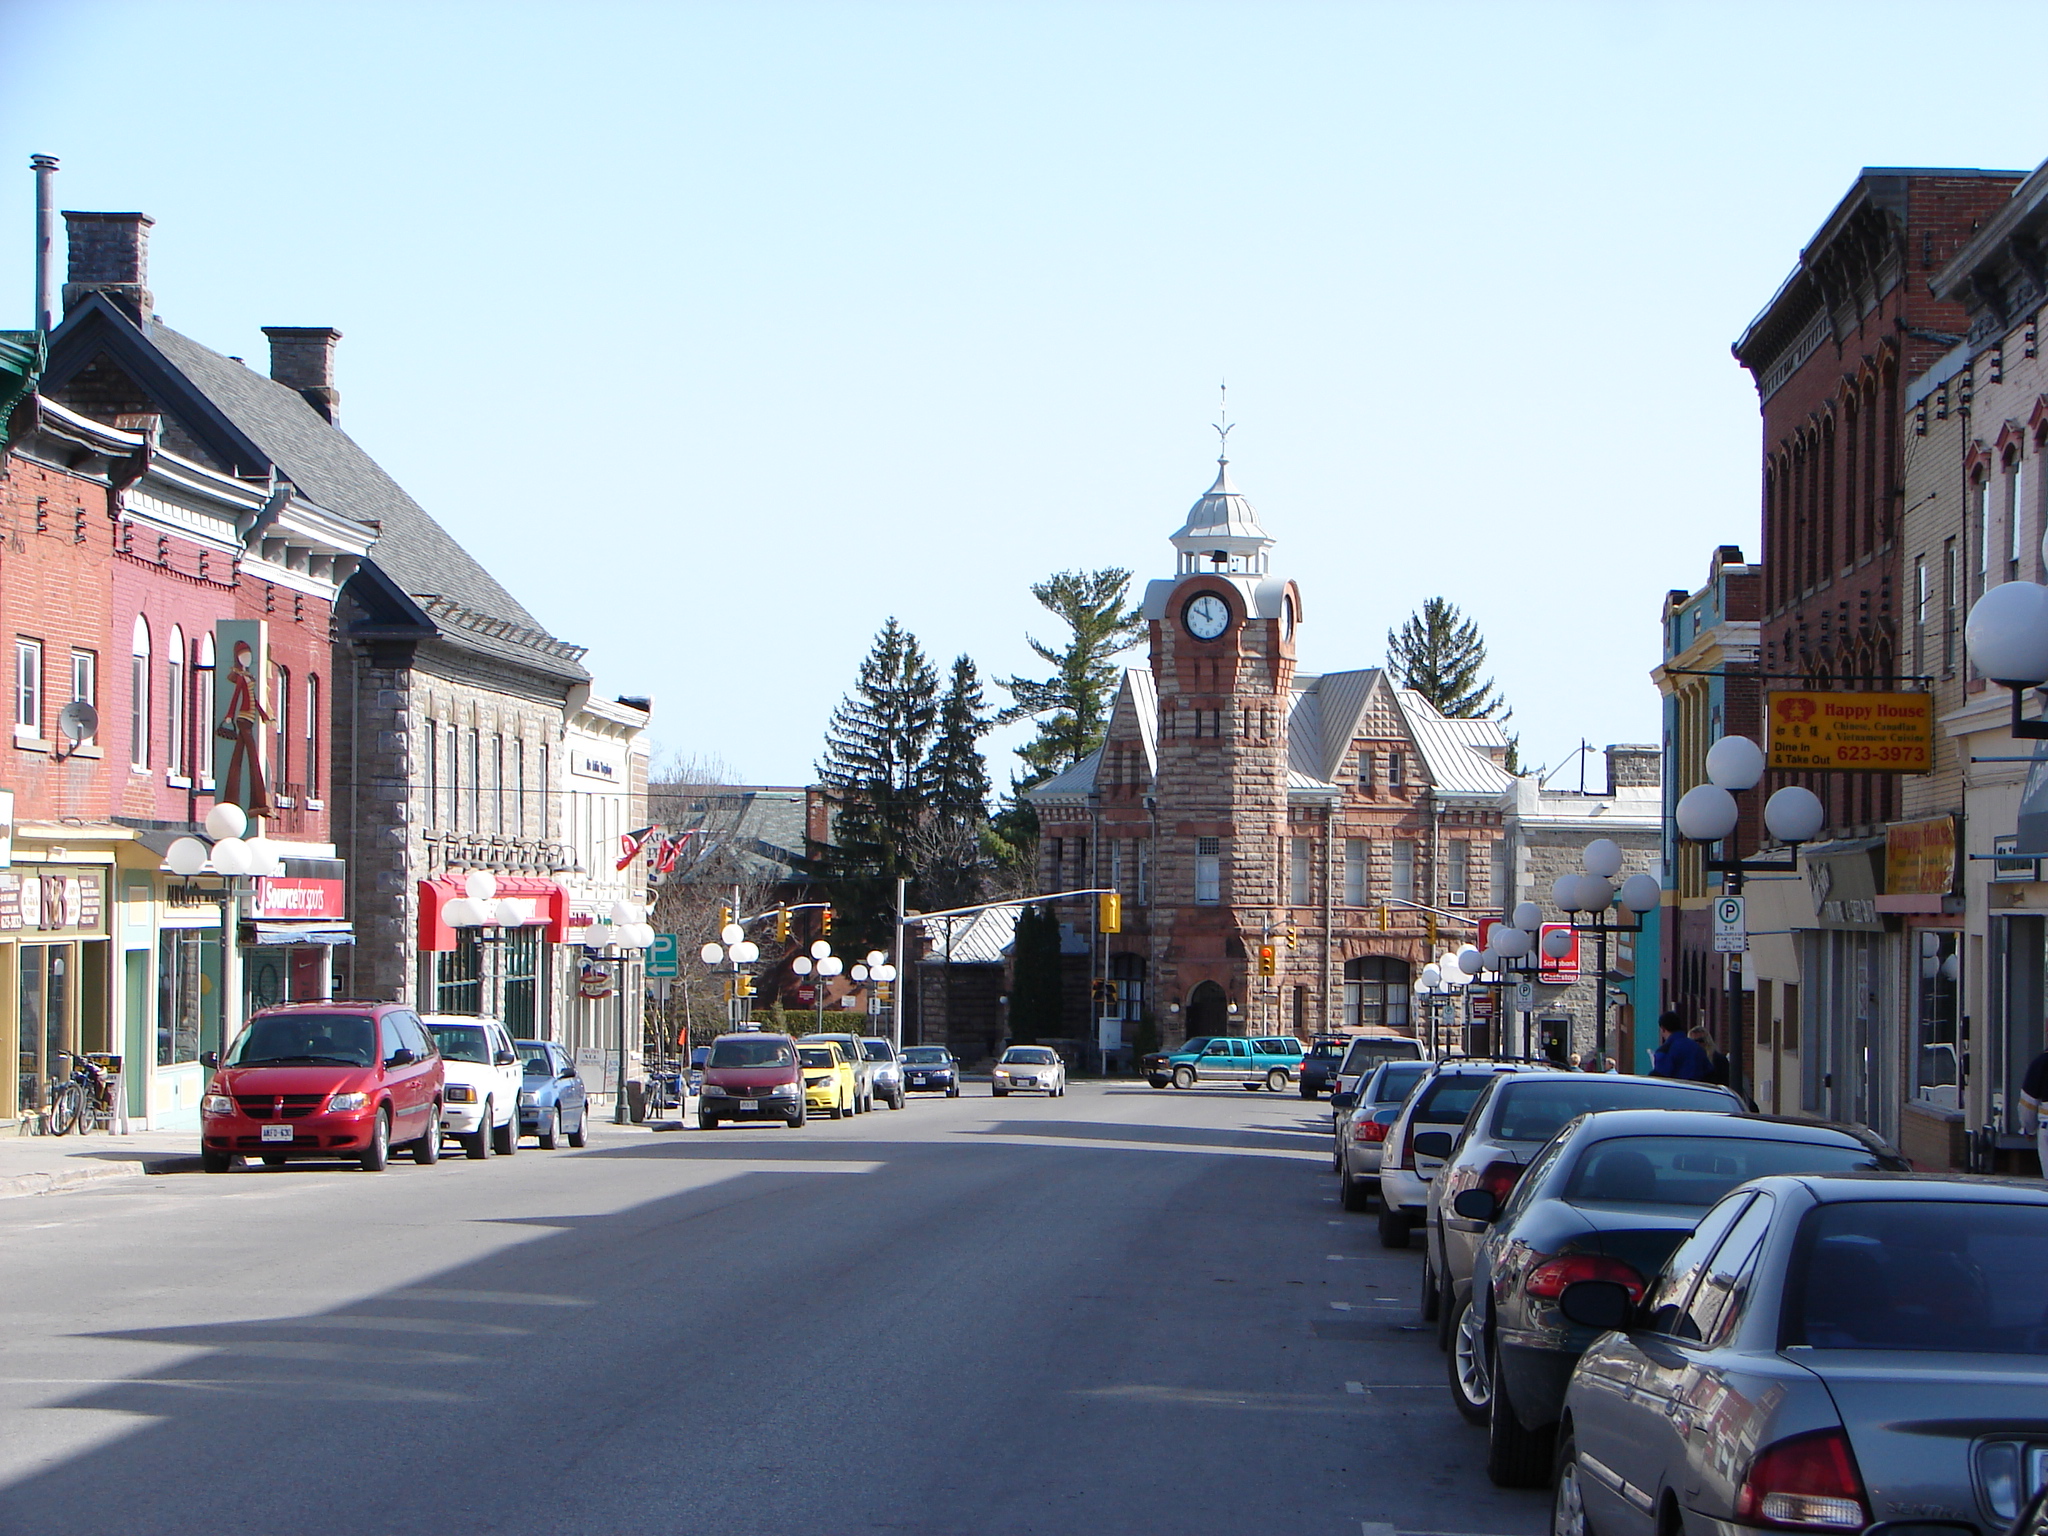
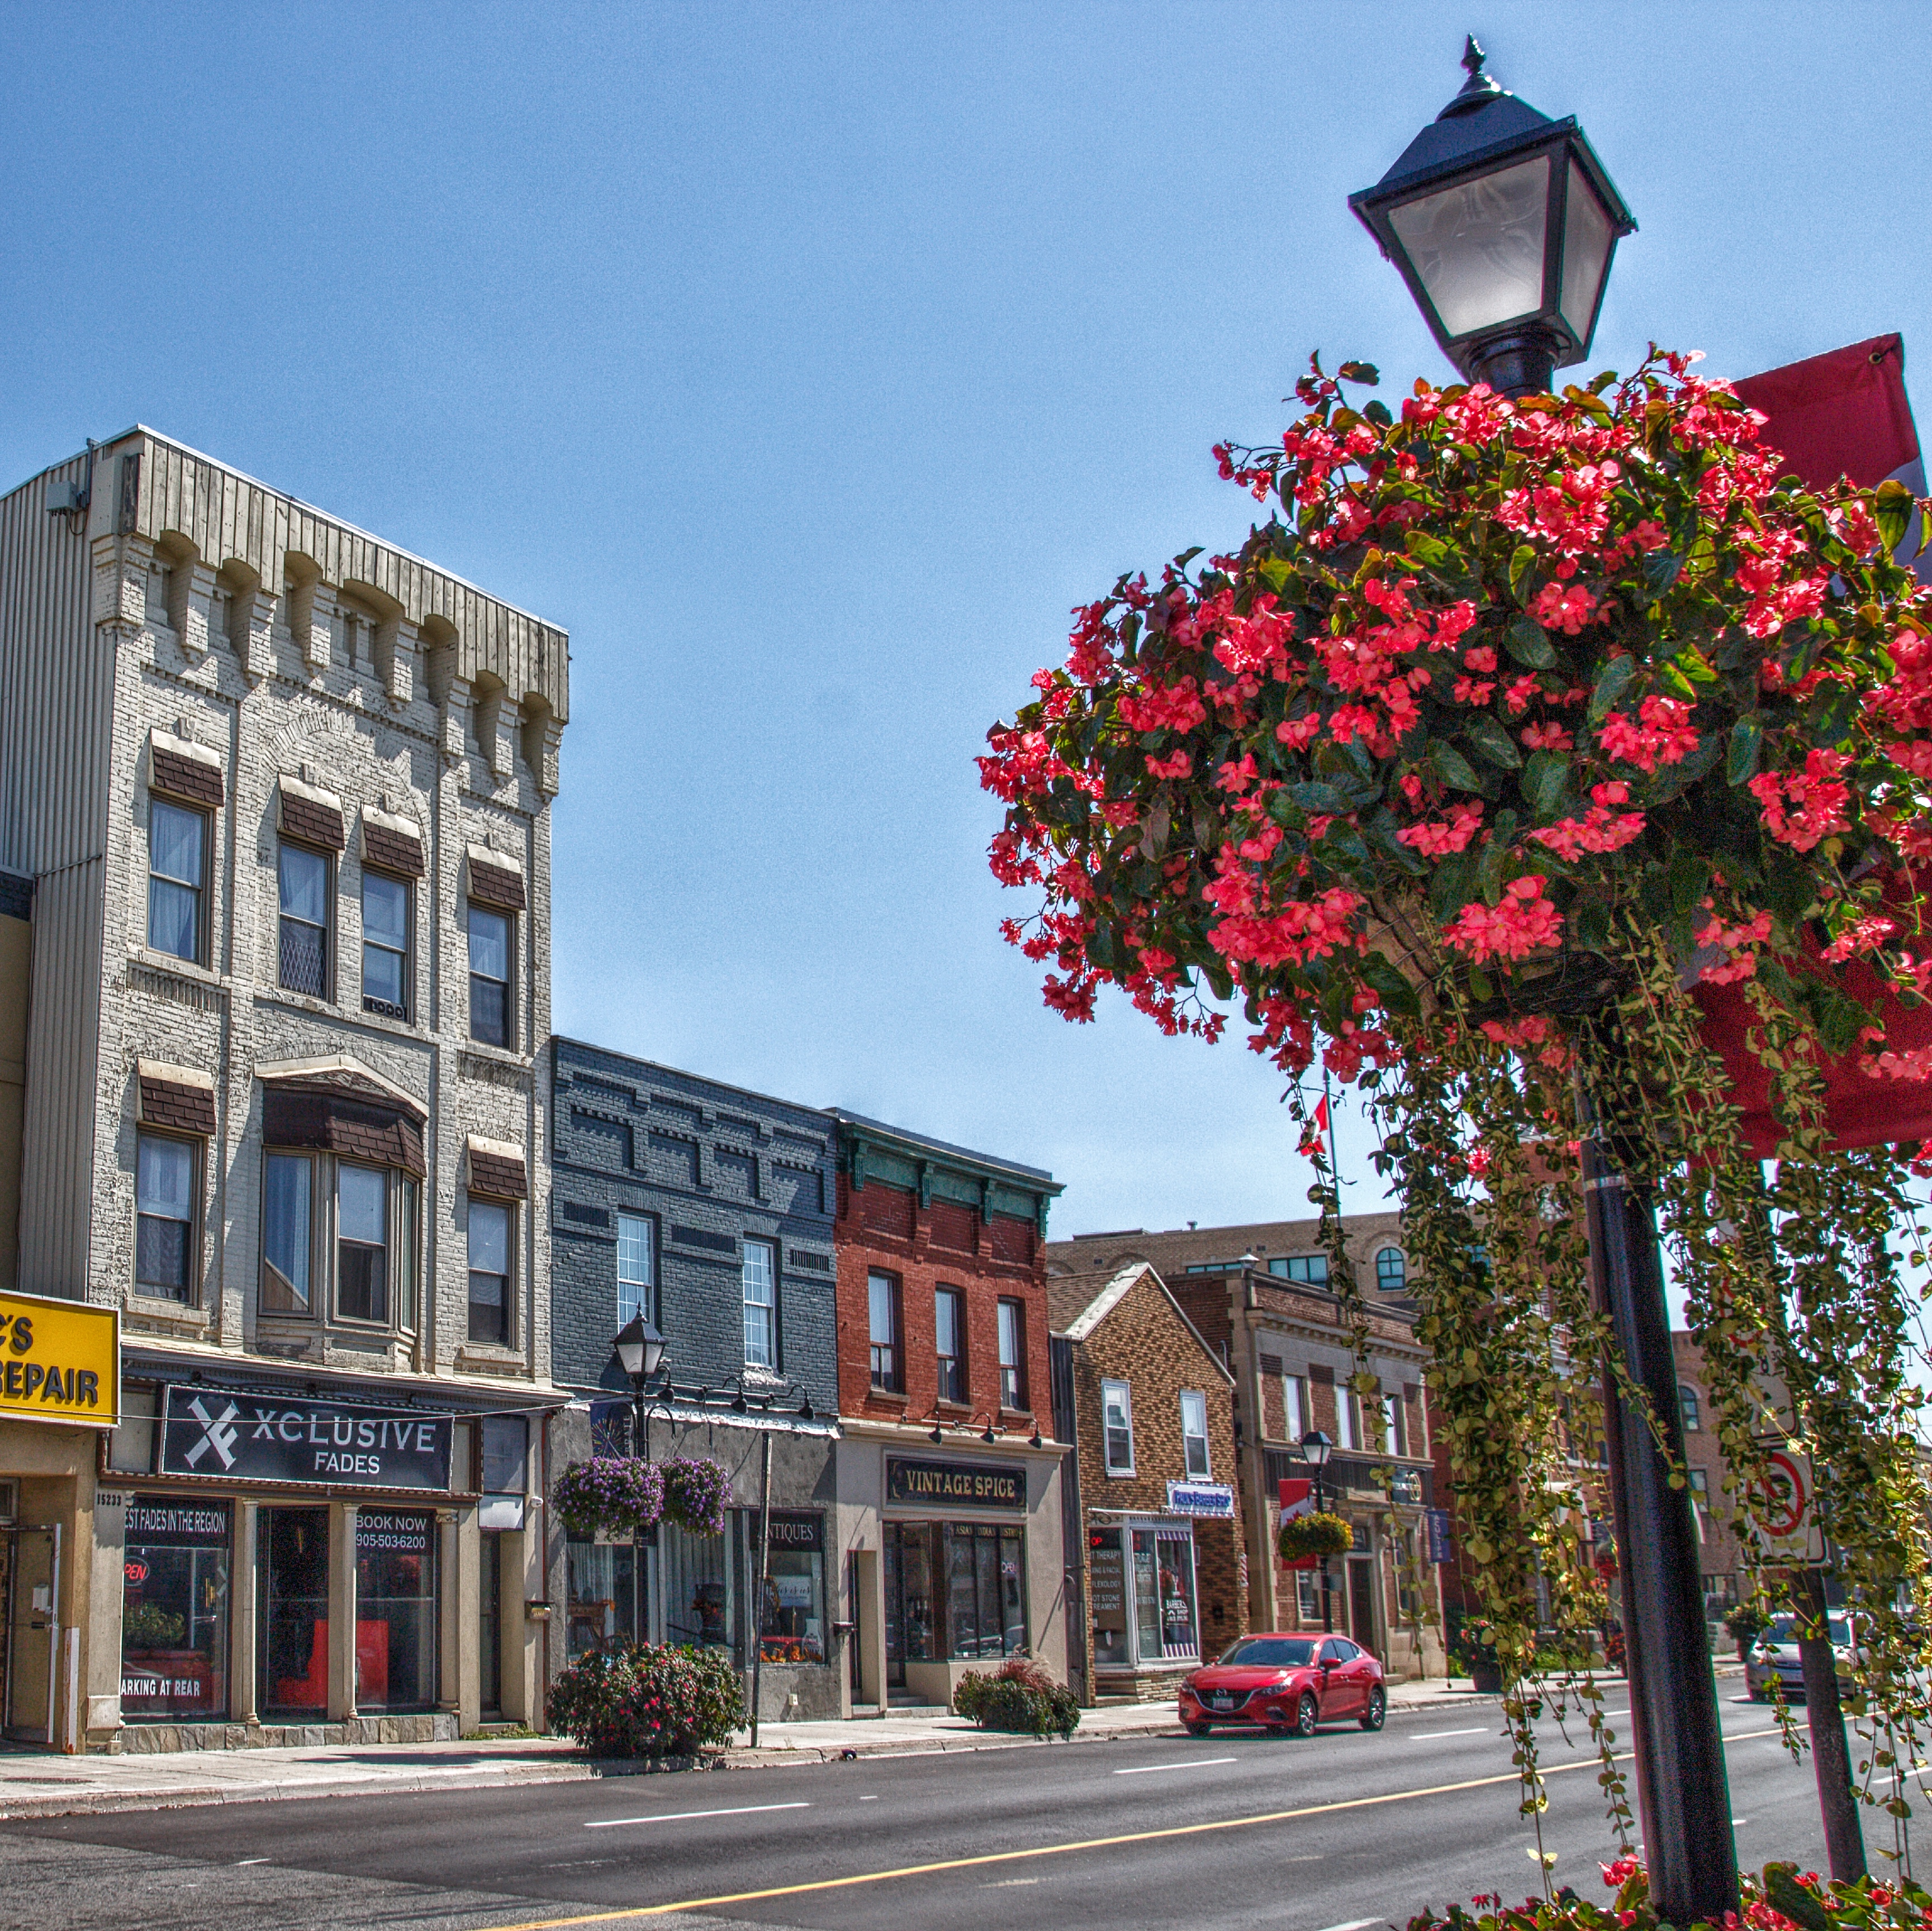
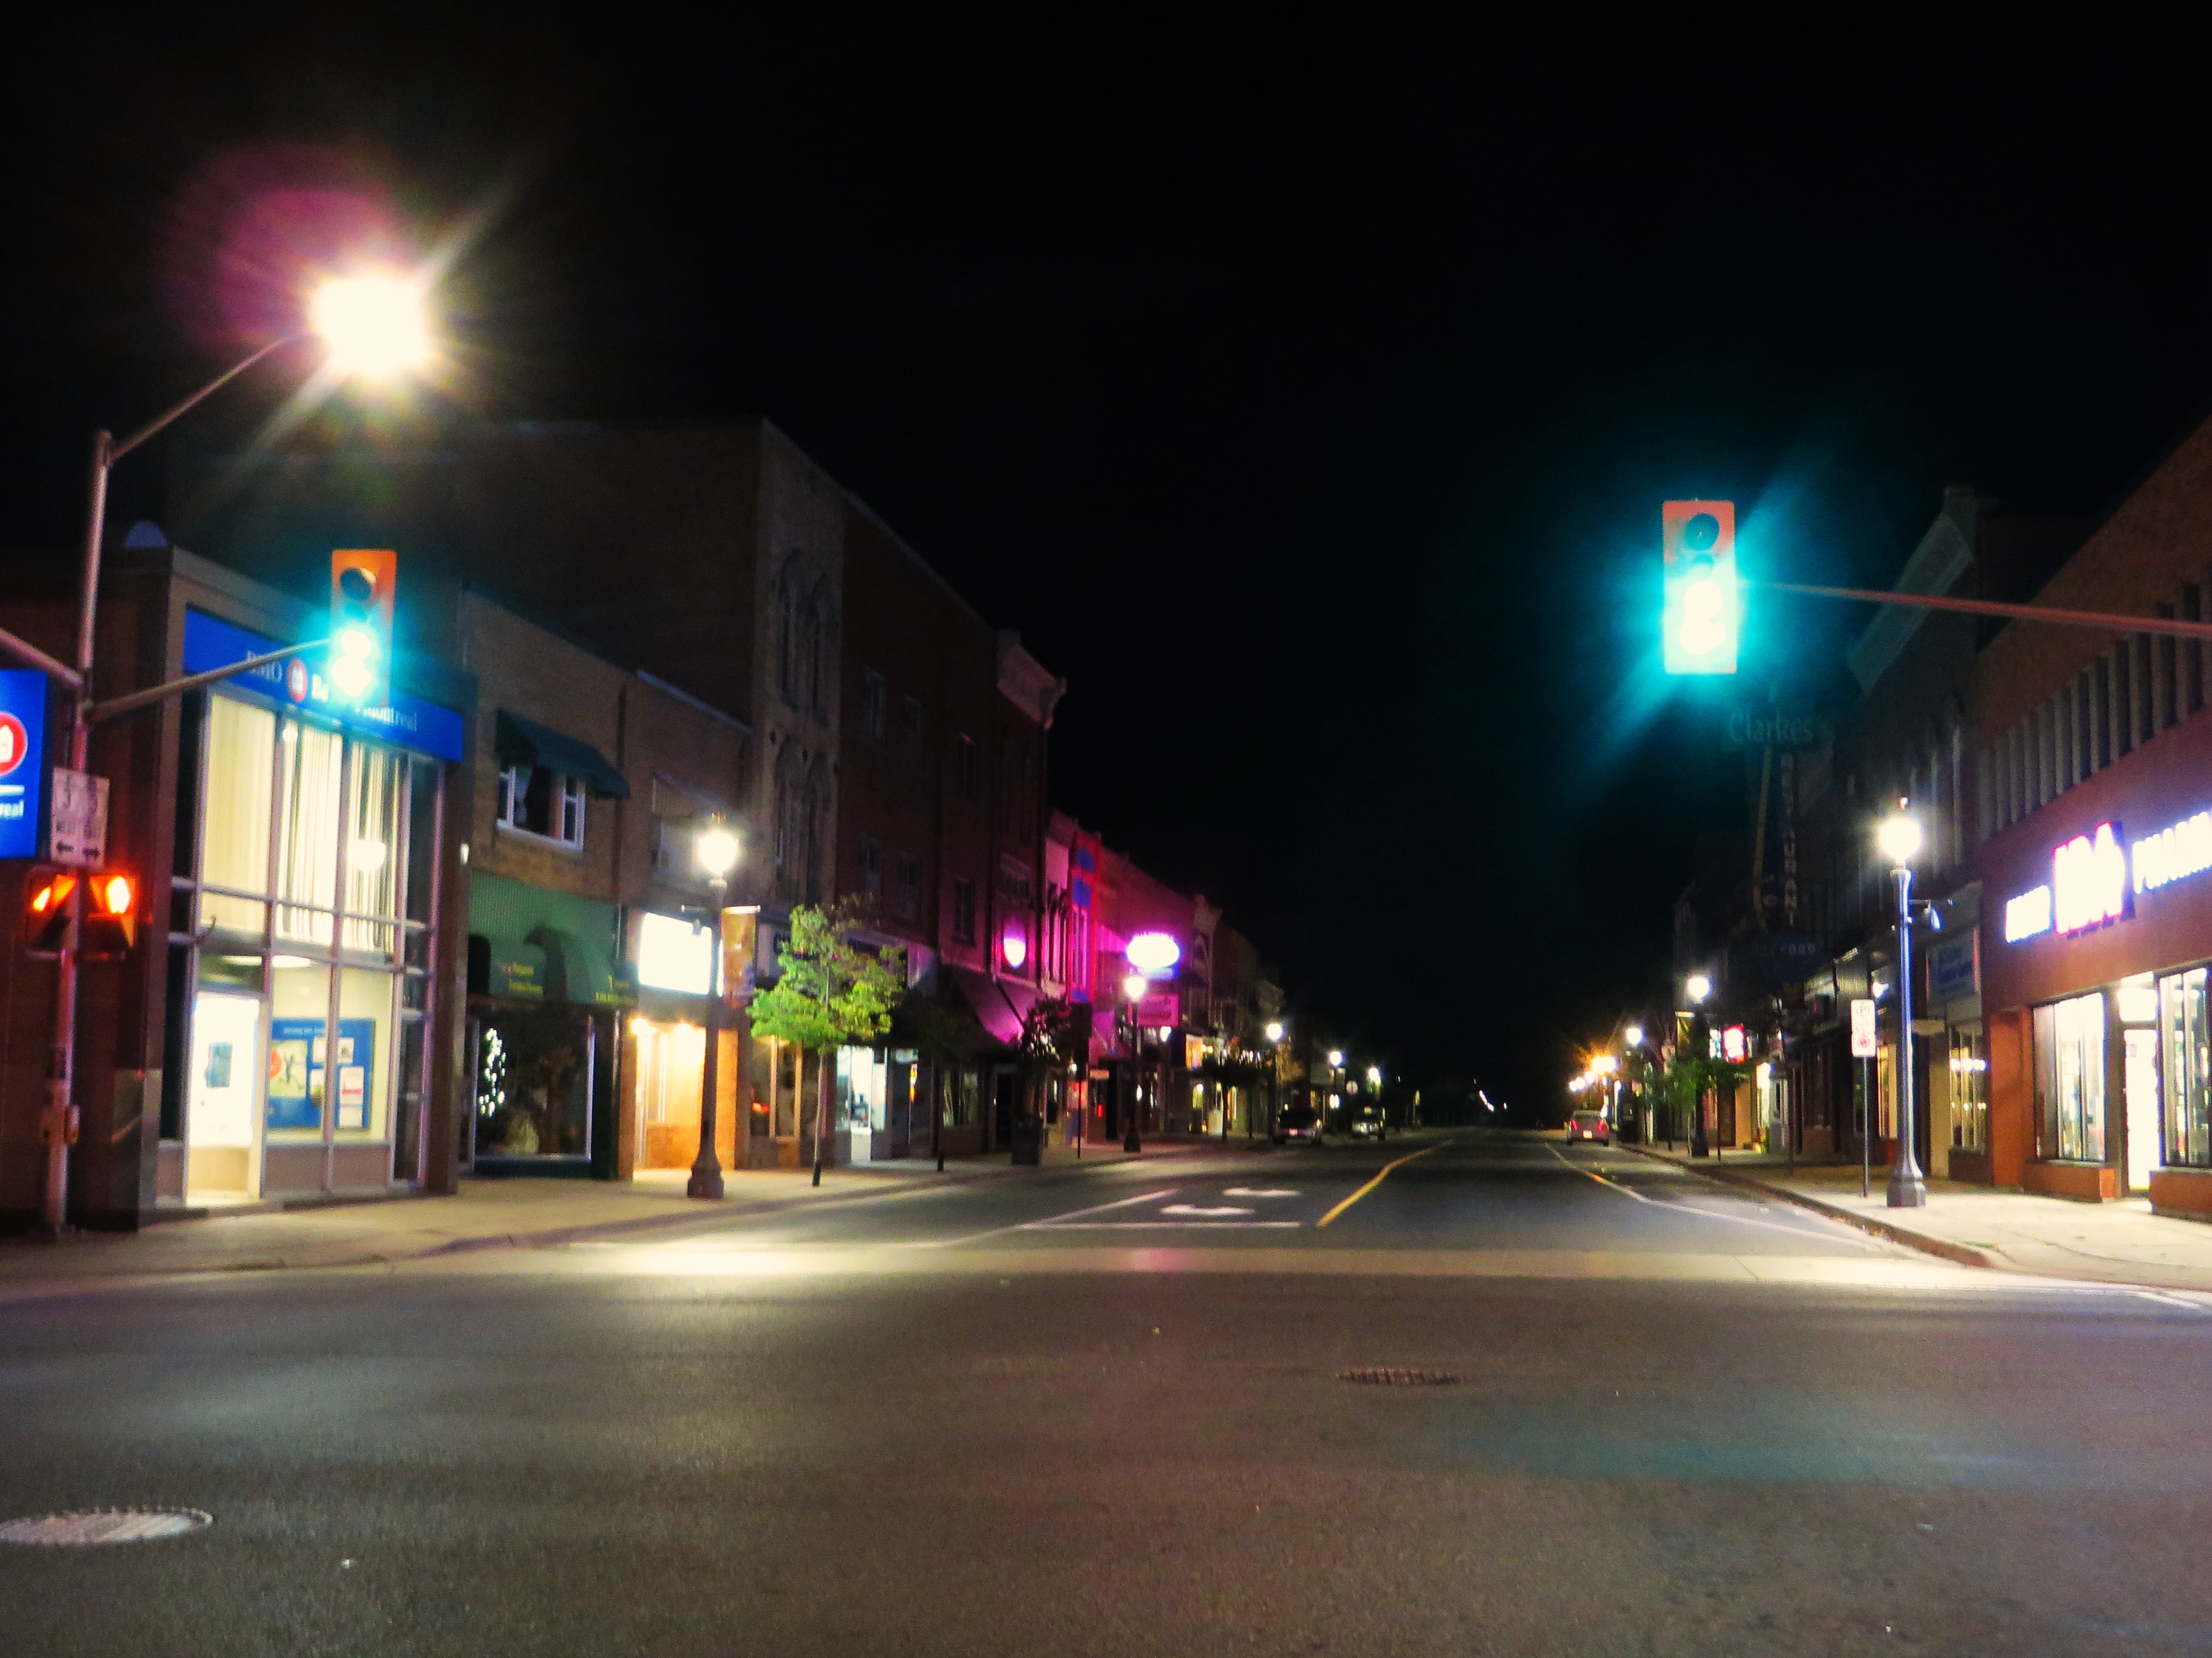
Cambridge, Ontario
Wikimedia Commons via Wikipedia

Ontario · Civic arena

Cambridge

Cambridge drinking water hardness is 156 mg/L on OpenStats, plus City Score rankings and local readings.

Civic arena · hometown HUD

Cambridge

City138k pop
49XP
#198

#198 of 343

49% City Score XP

DroppingDirect
City Score XP

7/8 pillars on the board

49%#198

Decade trail

Cambridge packs 7 of eight open-data pillars into its composite standing. Tap a rival below to see how the hometown stacks up head-to-head.

Cambridge drinking water

Direct municipal reading

Hardness, pH, and lead from municipal reports on the OpenStats water atlas.

Hardness
156 mg/L
hard
pH
7.3999999999999995
Lead
0.4 μg/L

Full Cambridge water quality report →City Score rankingsCompare cities · vs Belleville · vs HawkesburyHardness guide

Watershed to tap · system map

How Cambridge's water works

Open full map

Source, treatment, and distribution for Cambridge from municipal and provincial water records. Hardness and grade are published readings.

Local numbers for Cambridge

Drinking water first, then permits, tax, internet, radon, and hazards for Cambridge.

How Cambridge scores

Dropping57

Cambridge sits at City Score rank #198 with a standing of 49%, from 7 of 8 open-data pillars (tax, construction, connectivity, indoor air, water, seismic hazard, growth, safety). Missing pillars score at median standing so thin coverage cannot inflate the rank. Dropping 57 places versus 2022 (#141 → #198).

Latest owned placements: building permit value rank #186 of 343 (2025); indoor radon rank #40 of 343 at 256 Bq/m³ survey mean; residential mill rate rank #256 of 343 (8.38 mill rate). Full tables and method notes live on each study edition; atlas readings for the same slug open from the topic buttons.

#198
Arena rank (of 343)
49%
City Score
7
Pillars observed
Dropping57
vs 2022
#141 → #198

Arena loadout

Topic XP bars

Arena rank #198 of 343

City Score

7/8 pillars · main XP bar

49%#198
Drinking water

Rank #206

60%
Building permits

Rank #186

46%
Internet

Rank #119

66%
Radon

Rank #40

12%
Hazards

No placement

Property tax

Rank #256

75%

Achievements

Dropping -57Direct municipal reading

Hometown notes

Archive

Earlier years: 2026 · 2025 · 2024 · 2023

Cambridge in brief

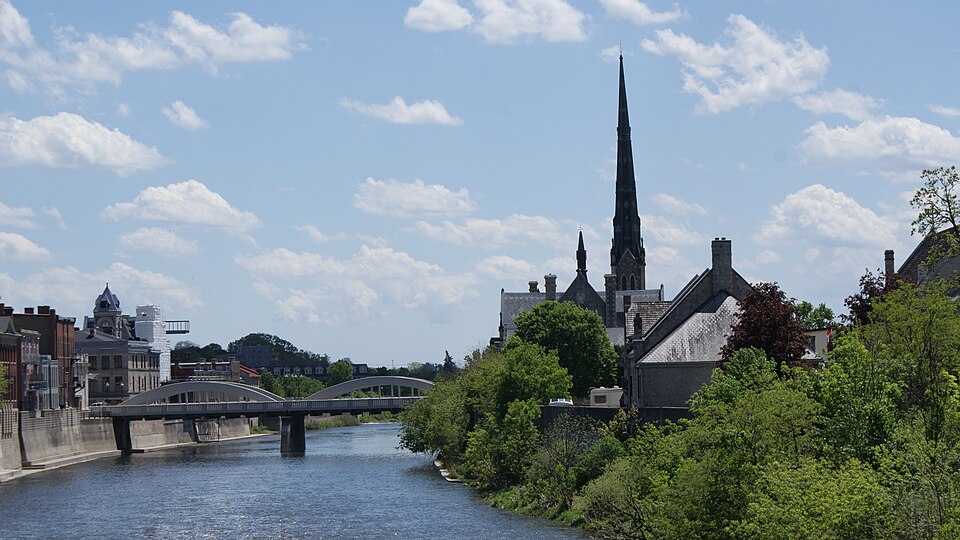
Cambridge tells outsiders one name and locals three. Municipal history is clear that Galt, Preston, and Hespeler were pushed into one city in 1973, and that people still introduce themselves by the old towns first. Tourism pages call them three distinct urban areas along Grand River frontage inside Waterloo Region, with Blair folded into the story earlier through Preston. Highway 401 and Hespeler Road keep the city plugged into the rest of southern Ontario, while Grand River Transit knits trips between the cores. You're at home here is the municipal welcome line, and it only works if you accept that home still has three front doors.

Saturday mornings still orbit the Cambridge Farmers' Market at 40 Dickson Street beside City Hall in the Galt area, a market the city dates to about 1830. Cambridge Summer Live! fills warm evenings with free concerts and movie nights. Hill 60 Park turns up when residents are asked to help pick a new playground. Service Cambridge handles the unglamorous errands, from licences to service requests, and the Holiday Market lands on the civic calendar each winter. Between the rivers and the market stalls, the city feels less like a suburb of somewhere else and more like neighbouring mill towns that finally share a tax bill.

Cambridge Times covers the Hespeler Road commute and runs a Best of Cambridge vote that treats the whole amalgamation as one shopping map. Speed River geography still matters in Preston and Hespeler the way the Grand does in Galt. On OpenStats City Score for 2026, Cambridge sits at rank 32 of 125. The hometown test is simple: if someone says they are from Hespeler, they mean it.
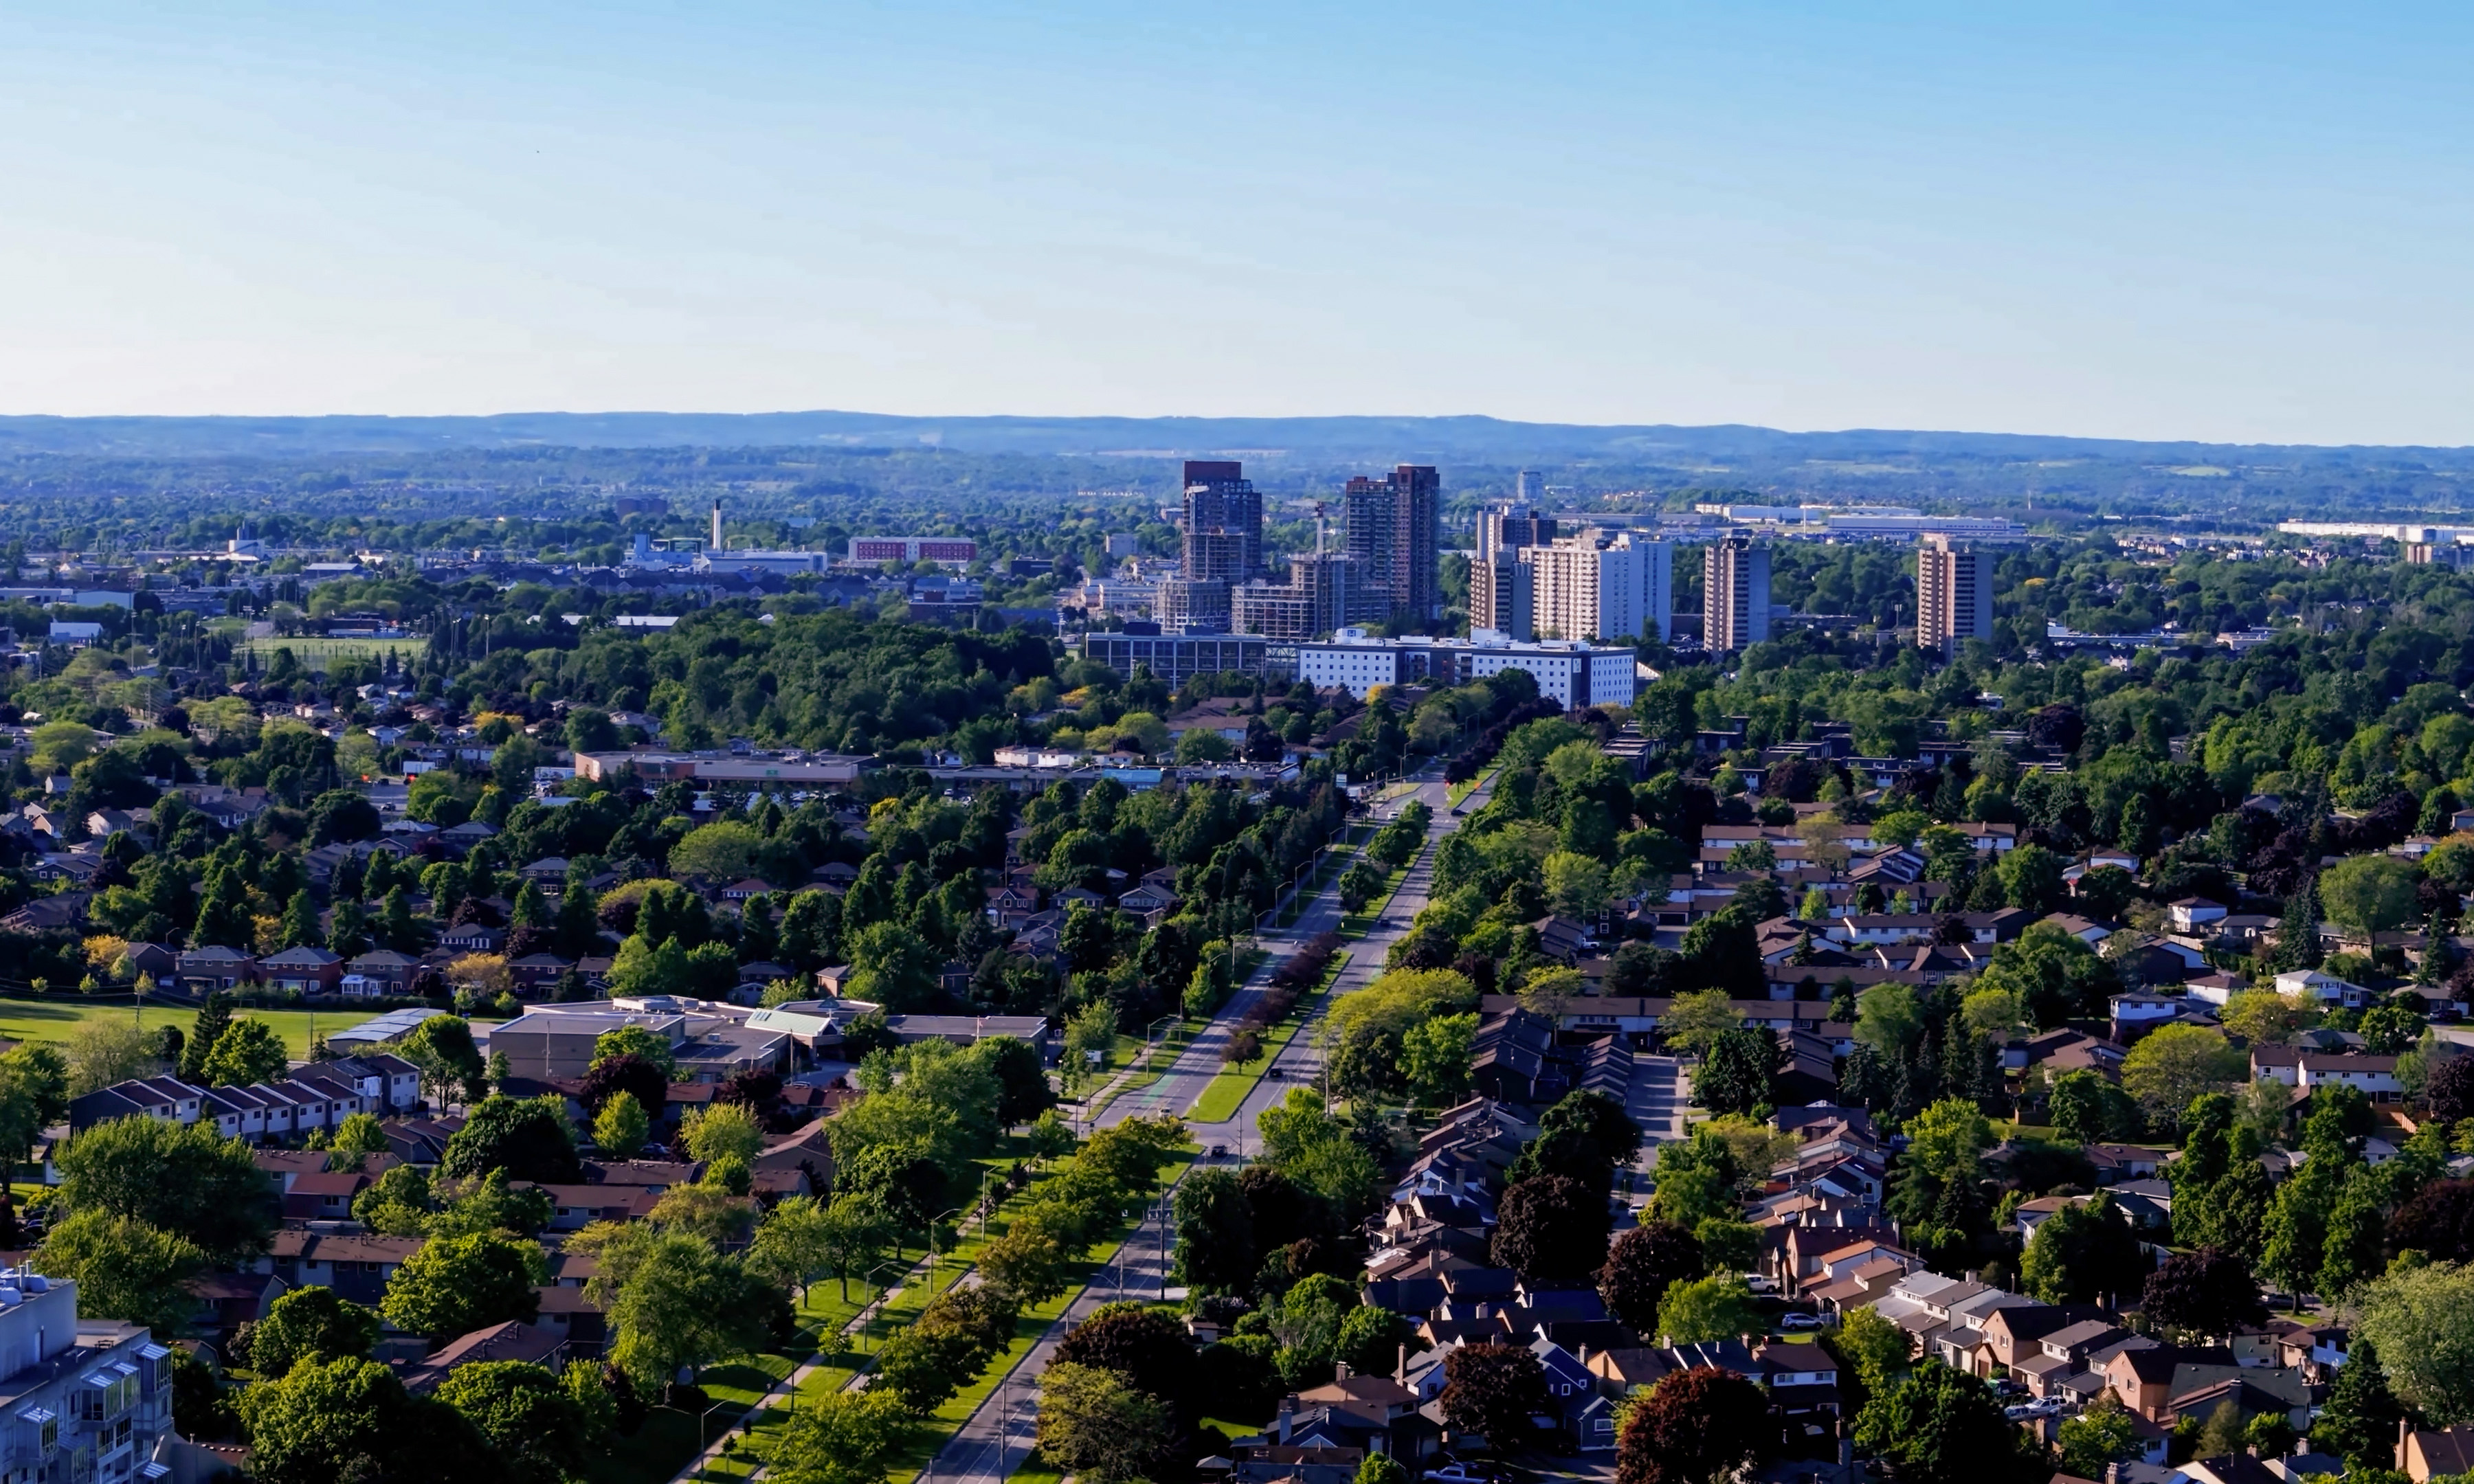
Drawn from City of Cambridge - Local History, City of Cambridge - Tourism, City of Cambridge - Farmers' Market, Cambridge Times.

City Score over time

City Score from 2016–2025 across eight open-data pillars. Individual study placements are listed in the panels below.

0%25%50%75%100%2016201720182019202020212022202320242025
OpenStats City Score

Rankings for Cambridge

Each study below is its own ranking. Where a study has more than one edition for this city, the chart shows standing across those years only.

Connectivity · OpenStats

OpenStats Broadband Download Speeds

OpenStats

Cities ranked by estimated best advertised download (Mbps). Anchored to the current ISED National Broadband Data vintage, then backcast along a national speed curve with city-specific fiber-arrival and 50/10 availability paths so relative ranks can change over the decade. Not a claim of audited historical hex maps for every year.

10 editions · 2016–2025

#119
Latest · 2025 · of 343
Score 509.6

Construction · OpenStats

OpenStats Building Permit Value

OpenStats

Cities ranked by calendar-year building permit value. Direct rows sum Statistics Canada Table 34-10-0292-01. Cities without a direct reading use population × provincial per-capita permit intensity (estimated), so every seed city has a year-varying construction signal.

10 editions · 2016–2025

#186
Latest · 2025 · of 343
Score 434461508

Composite · OpenStats

OpenStats City Score

OpenStats

Dimensional average of OpenStats open-data pillars for each panel year 2016–2025: tax, construction, connectivity, indoor air, water, seismic hazard, population growth, and crime severity. Each series is scored 0–1 within its edition; series in the same pillar are averaged, then all eight pillars are averaged with equal weight. Missing pillars score at median standing (0.5). Growth and CSI use StatCan annual tables; permits, mill rates, and broadband use live rows plus documented year-varying estimates where needed. Radon, water, and PGA may be survey/model vintages carried forward and are flagged when static for more than two years. External commercial livability lists are never inputs.

10 editions · 2016–2025

#198
Latest · 2025 · of 343
Score 0.488

Safety · OpenStats

OpenStats Crime Severity Index

OpenStats

Communities ranked by Statistics Canada Crime Severity Index (Table 35-10-0026-01). Rank 1 is highest CSI (worse). Values are CMA where a metro match exists, otherwise provincial CSI. Hometown pages label the grain.

10 editions · 2016–2025

#190
Latest · 2025 · of 343
Score 66.82

Water · OpenStats

OpenStats Drinking Water Hardness

OpenStats

Communities ranked by municipal drinking-water hardness (mg/L as CaCO₃). Hardness changes slowly; the atlas vintage is carried across panel years and flagged when static for more than two years.

10 editions · 2016–2025

#206
Latest · 2025 · of 343
Score 156

Health · OpenStats

OpenStats Highest Indoor Radon

OpenStats

Communities ranked by Health Canada survey mean indoor radon (Bq/m³). Rank 1 is the highest mean. Decade panel years without a new survey carry the CMA survey vintage forward; they are not annual retests.

10 editions · 2016–2025

#40
Latest · 2025 · of 343
Score 256

Growth · OpenStats

OpenStats Population Growth

OpenStats

Cities ranked by year-over-year population growth from Statistics Canada annual CSD estimates (Table 17-10-0155-01). Rank 1 is fastest growth. A few places without a clean CSD match use a provincial-path estimate anchored to seed population.

10 editions · 2016–2025

#228
Latest · 2025 · of 343
Score 0.006280351991820937

Property tax · OpenStats

OpenStats Residential Mill Rates

OpenStats

Municipalities ranked by residential mill rate. Rank 1 is the highest rate. Published municipal years are used when available; gaps are interpolated or follow the provincial median path so the tax pillar moves year to year for every city.

10 editions · 2016–2025

#256
Latest · 2025 · of 343
Score 8.377331070153742

Worth knowing in Cambridge

Distinctive local notes and places, each linked to its source.

  • Municipal history says residents often tell each other they are from Galt, Preston, or Hespeler even while calling Cambridge home to outsiders.

    City of Cambridge - Local History

  • Cambridge Summer Live! stages free outdoor concerts, movie nights, and busker-style shows through the warm months.

    City of Cambridge

  • Tourism pages frame the city as three distinct urban areas with Grand River frontage inside Waterloo Region.

    City of Cambridge - Tourism

Places to see

Cambridge Farmers' Market

Year-round Saturday market at 40 Dickson Street in the Galt area. Directions still send you down Hespeler Road from the 401 and into downtown by Water Street.

Grand River frontage

Municipal tourism leads with scenic Grand River frontage tying the historic cores together. It is the outdoor spine locals point to when explaining why the amalgamation still feels like river towns.

Hill 60 Park

A neighbourhood park that recently asked residents to help choose the next playground design. Small civic choices like that keep the city feeling local between the three cores.

Follow Cambridge by email

When Cambridge moves in a ranking, posts new permit figures, or lands in a study, get a short note. A few sends a year, only when something changes.

No spam. Unsubscribe with one reply.

Related guides

More places in Ontario

All Ontario cities