Red Deer, Alberta
Wikimedia Commons via Wikipedia

Alberta · Civic arena

Red Deer

Red Deer drinking water hardness is 100 mg/L on OpenStats, plus City Score rankings and local readings.

Civic arena · hometown HUD

Red Deer

Census_metropolitan_area101k pop
45XP
#248

#248 of 343

45% City Score XP

RisingDirectSurface
City Score XP

7/8 pillars on the board

45%#248

Decade trail

Red Deer packs 7 of eight open-data pillars into its composite standing. Tap a rival below to see how the hometown stacks up head-to-head.

Red Deer drinking water

Direct municipal reading

Hardness, pH, and lead from municipal reports on the OpenStats water atlas.

Hardness
100 mg/L
moderately hard
pH
7.3
Lead
0.4 μg/L

Full Red Deer water quality report →City Score rankingsCompare cities · vs Rocky Mountain House · vs MorinvilleHardness guide

Watershed to tap · system map

How Red Deer's water works

Open full map

Source, treatment, and distribution for Red Deer from municipal and provincial water records. Hardness and grade are published readings.

Local numbers for Red Deer

Drinking water first, then permits, tax, internet, radon, and hazards for Red Deer.

How Red Deer scores

Rising+60

Red Deer sits at City Score rank #248 with a standing of 45%, from 7 of 8 open-data pillars (tax, construction, connectivity, indoor air, water, seismic hazard, growth, safety). Missing pillars score at median standing so thin coverage cannot inflate the rank. Rising 60 places versus 2022 (#308 → #248).

Latest owned placements: building permit value rank #271 of 343 (2025); indoor radon rank #182 of 343 at 150 Bq/m³ survey mean; residential mill rate rank #111 of 343 (11.25 mill rate). Full tables and method notes live on each study edition; atlas readings for the same slug open from the topic buttons.

#248
Arena rank (of 343)
45%
City Score
7
Pillars observed
Rising+60
vs 2022
#308 → #248

Arena loadout

Topic XP bars

Arena rank #248 of 343

City Score

7/8 pillars · main XP bar

45%#248
Drinking water

Rank #309

90%
Building permits

Rank #271

21%
Internet

Rank #168

51%
Radon

Rank #182

53%
Hazards

No placement

Property tax

Rank #111

32%

Achievements

Rising +60Direct municipal readingSurface water supply

Hometown notes

Archive

Earlier years: 2026 · 2025 · 2024 · 2023

Red Deer in brief

Red Deer is the city Red Deerians mean when they say Central Alberta has a centre. It is big enough to host a fair week and a baseball club, small enough that the river valley still feels like the town's shared backyard. The Red Deer River threads green space through the middle of everything, and most locals can point you toward Bower Ponds, Waskasoo Park, or the Capstone riverside blocks without checking a map.

Greater Downtown is the city's own language for that middle: Historic Downtown for the commercial and civic heart, Capstone for new mixed-use living beside the water, Railyards for the transition zone, and Parkvale for mature streets within walking distance. Summer programming leans into that geography. Westerner Days brings the downtown parade that opens fair season. Ross Street Patio fills with music. The Afro-Caribbean Festival takes over 50 Street by City Hall Park. Heritage Day still draws crowds to Rotary Recreation Park and the Red Deer Museum and Art Gallery.

Beyond the festival calendar, Red Deerians live with parkland that would surprise visitors expecting only highway frontage. Gaetz Lake Sanctuary keeps a large refuge for native plants and animals inside city limits. McKenzie Trails and Maskepetoon Park offer quieter forest and marsh loops. Heritage Ranch anchors equestrian trails and a trout pond on the west side. Winter drivers watch for Snow Zone alerts; kids chase summer through Rip 'n Rec. Highway 2 improvements stay on the council agenda because the corridor is how Central Alberta arrives and leaves. The Red Deer Riggers keep baseball in the local sports conversation. Put together, it is a river city that still gathers outdoors and still names its neighbourhoods with care.
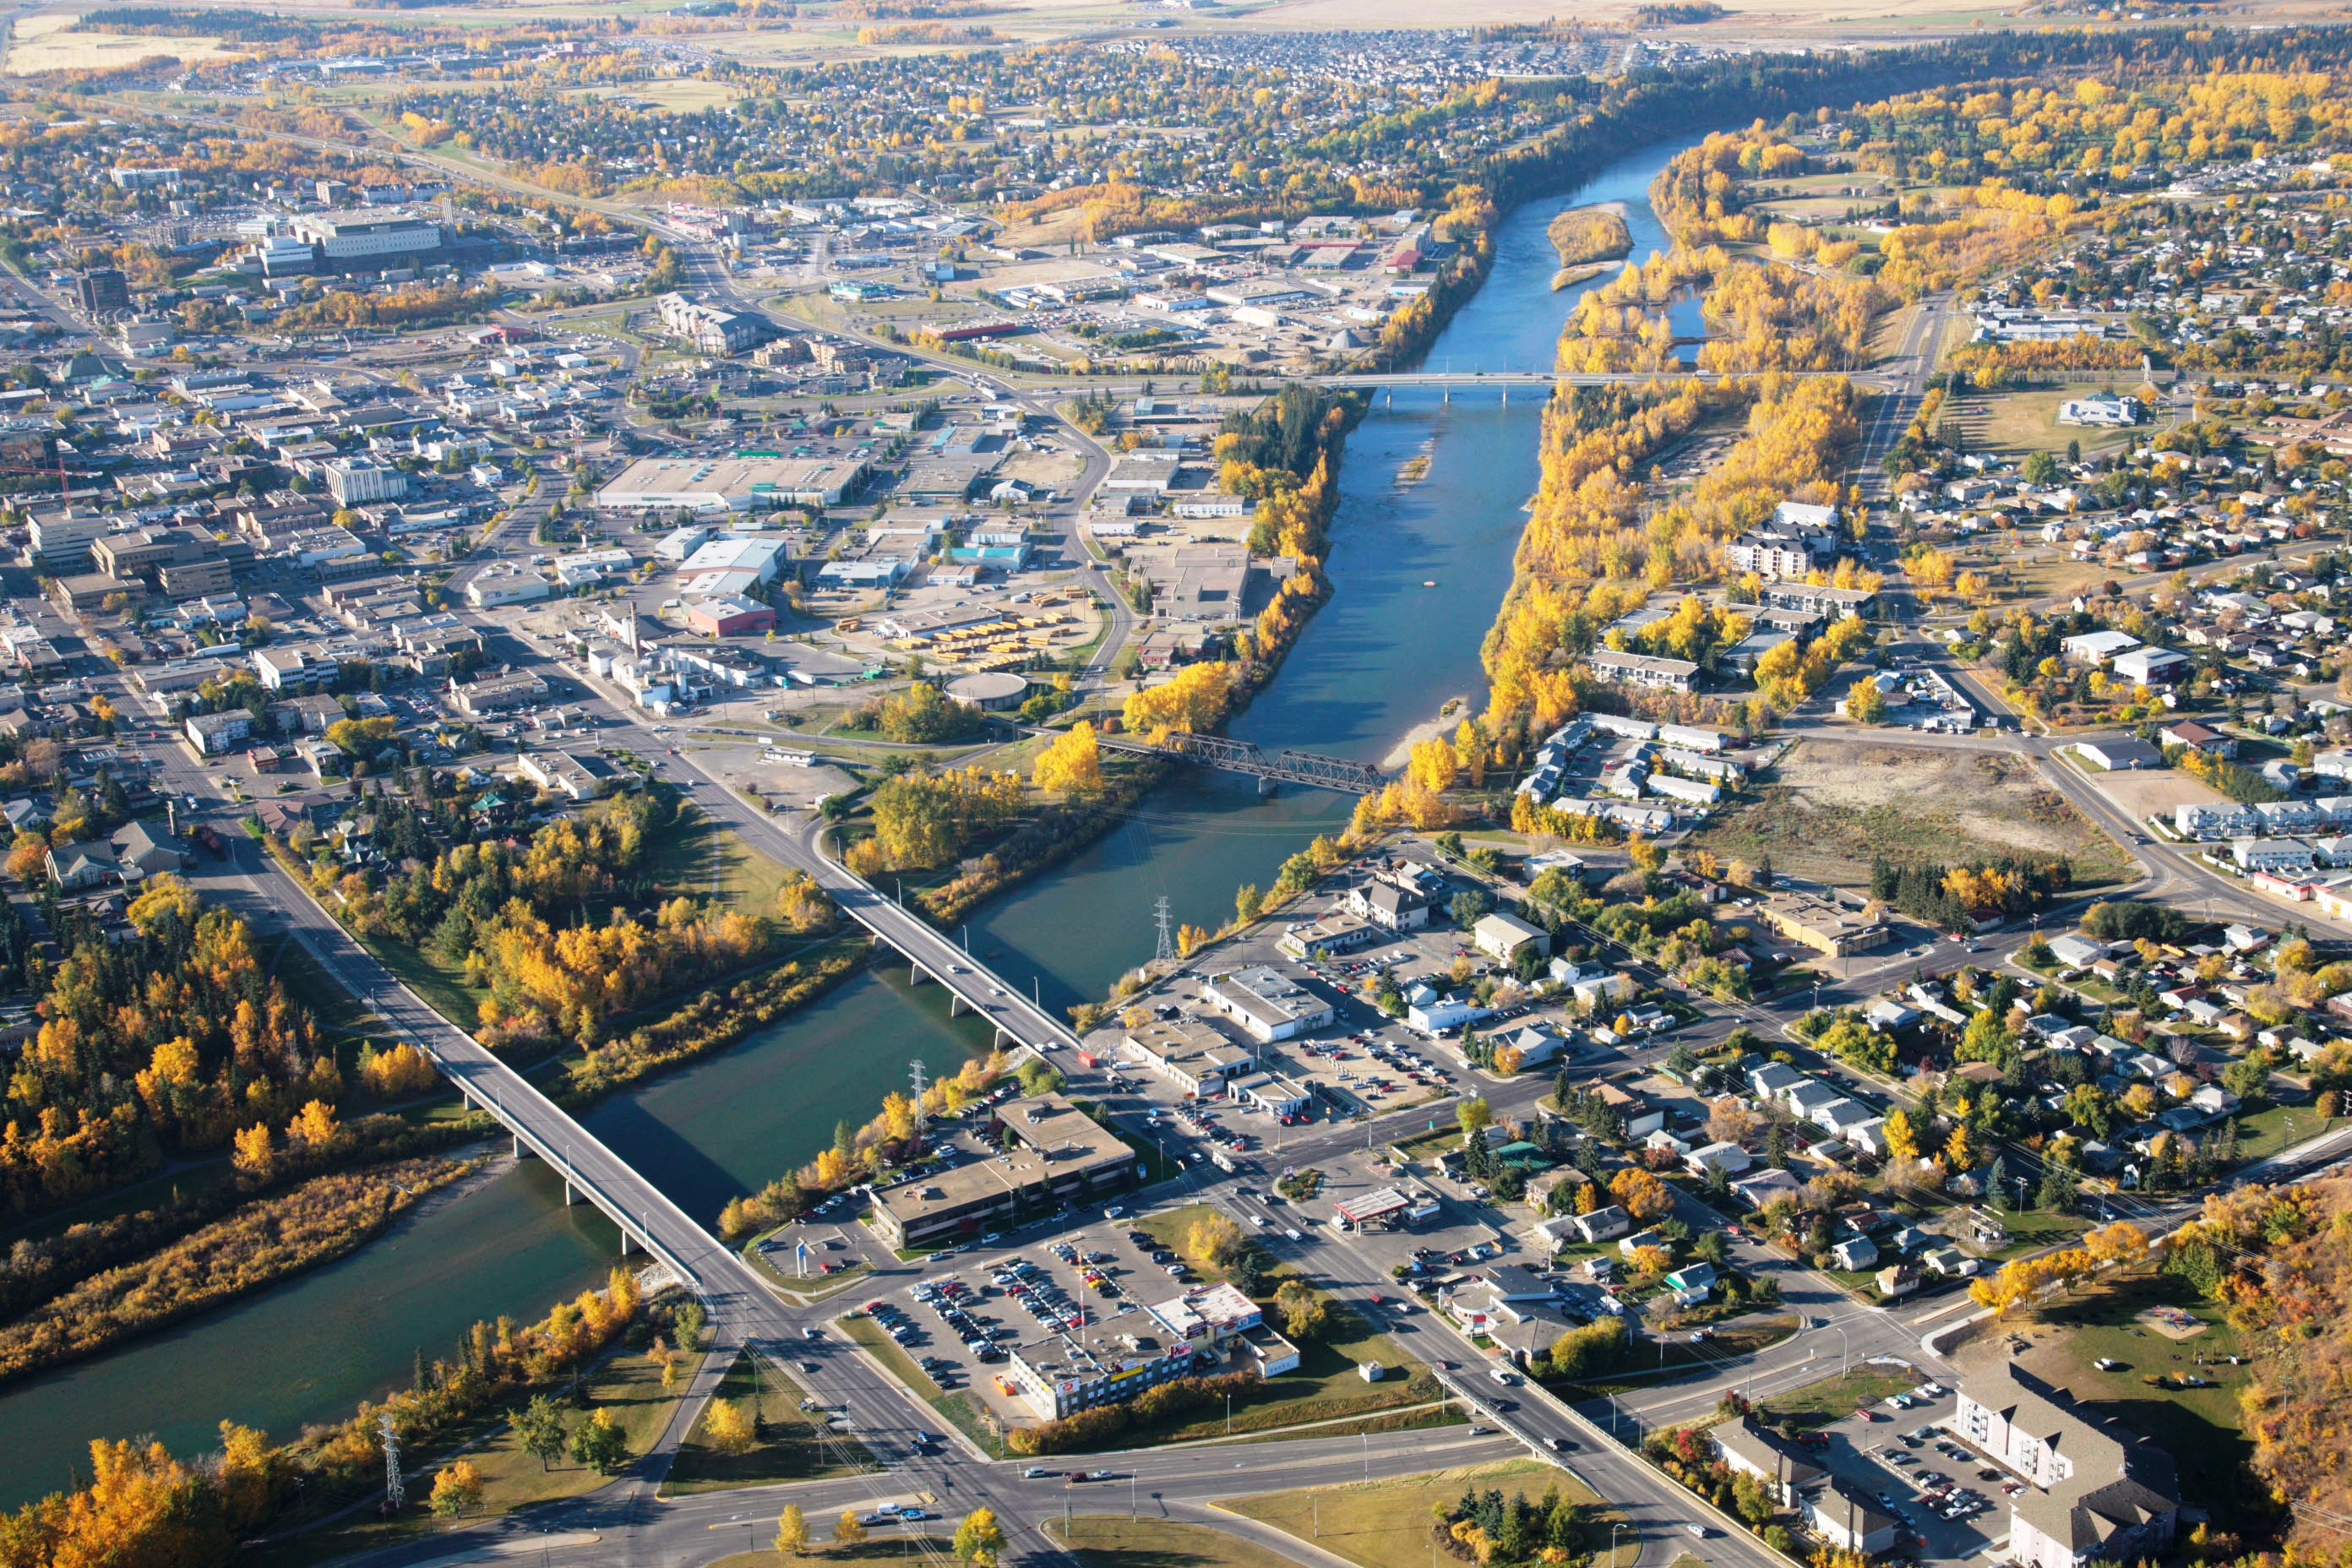
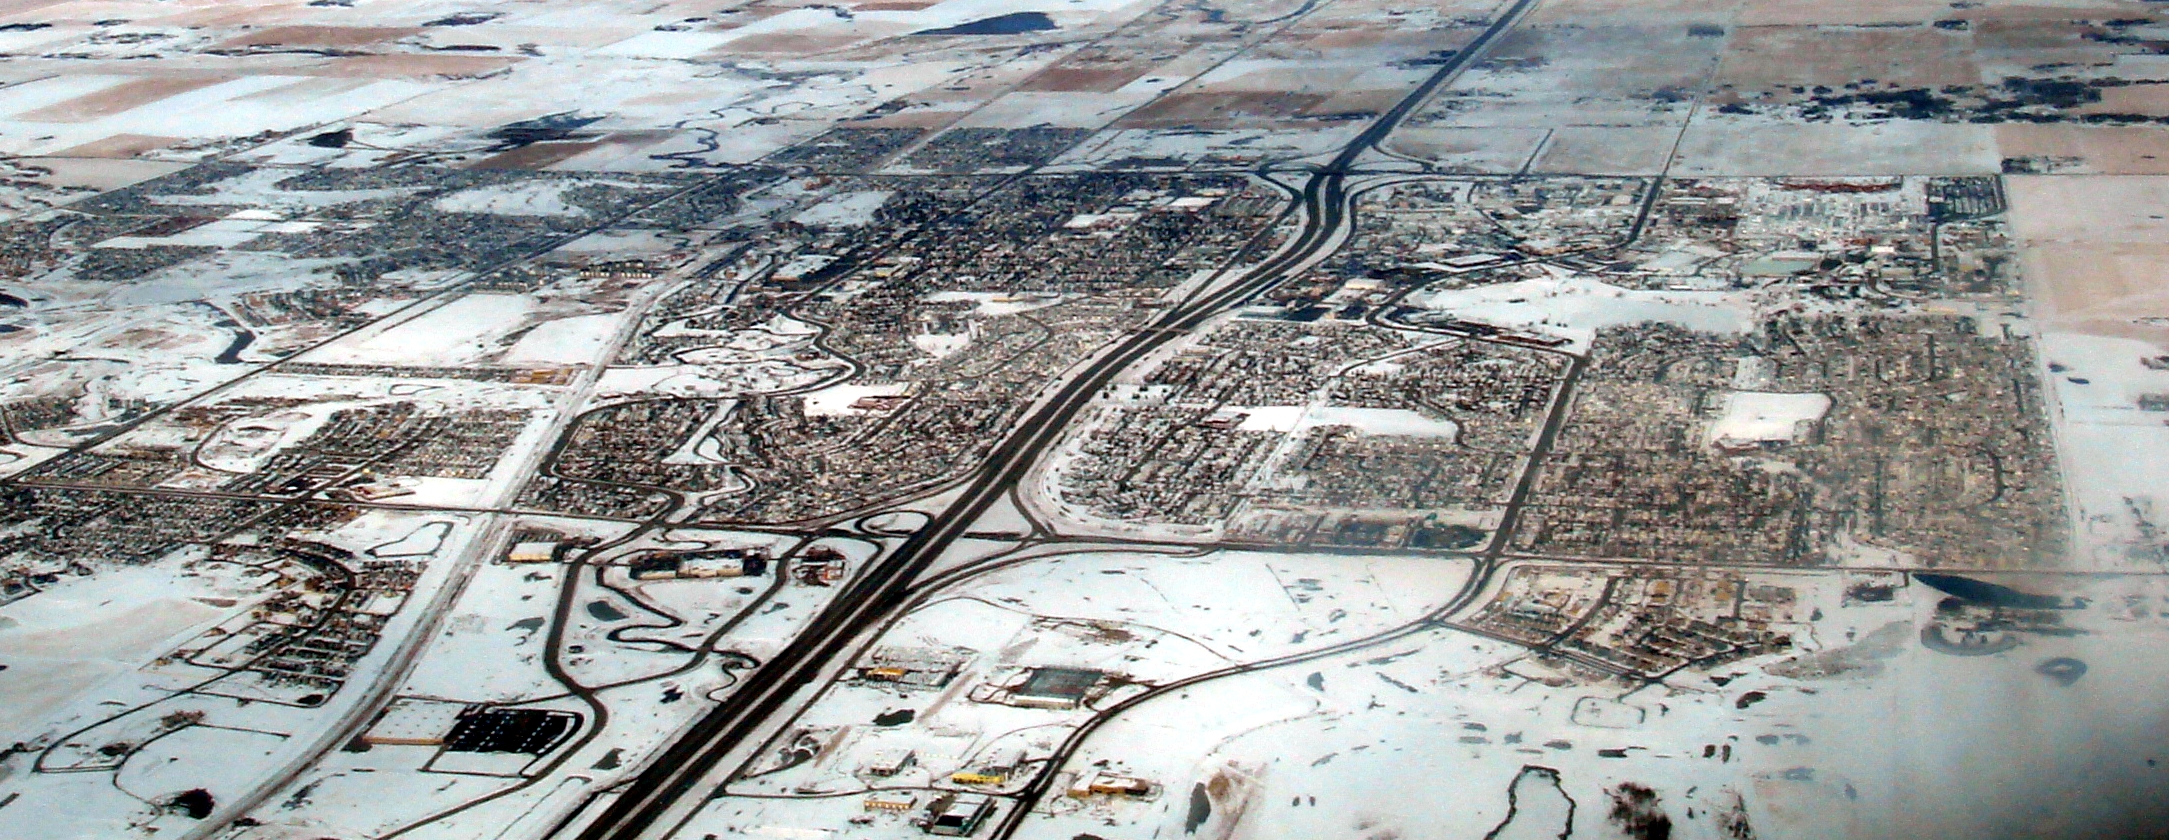
Drawn from City of Red Deer - Greater Downtown, City of Red Deer - Downtown, City of Red Deer - Bower Ponds, City of Red Deer - Trails and parks, Red Deer Advocate.

City Score over time

City Score from 2016–2025 across eight open-data pillars. Individual study placements are listed in the panels below.

0%25%50%75%100%2016201720182019202020212022202320242025
OpenStats City Score

Rankings for Red Deer

Each study below is its own ranking. Where a study has more than one edition for this city, the chart shows standing across those years only.

Connectivity · OpenStats

OpenStats Broadband Download Speeds

OpenStats

Cities ranked by estimated best advertised download (Mbps). Anchored to the current ISED National Broadband Data vintage, then backcast along a national speed curve with city-specific fiber-arrival and 50/10 availability paths so relative ranks can change over the decade. Not a claim of audited historical hex maps for every year.

10 editions · 2016–2025

#168
Latest · 2025 · of 343
Score 431.7

Construction · OpenStats

OpenStats Building Permit Value

OpenStats

Cities ranked by calendar-year building permit value. Direct rows sum Statistics Canada Table 34-10-0292-01. Cities without a direct reading use population × provincial per-capita permit intensity (estimated), so every seed city has a year-varying construction signal.

10 editions · 2016–2025

#271
Latest · 2025 · of 343
Score 258225240

Composite · OpenStats

OpenStats City Score

OpenStats

Dimensional average of OpenStats open-data pillars for each panel year 2016–2025: tax, construction, connectivity, indoor air, water, seismic hazard, population growth, and crime severity. Each series is scored 0–1 within its edition; series in the same pillar are averaged, then all eight pillars are averaged with equal weight. Missing pillars score at median standing (0.5). Growth and CSI use StatCan annual tables; permits, mill rates, and broadband use live rows plus documented year-varying estimates where needed. Radon, water, and PGA may be survey/model vintages carried forward and are flagged when static for more than two years. External commercial livability lists are never inputs.

10 editions · 2016–2025

#248
Latest · 2025 · of 343
Score 0.448

Safety · OpenStats

OpenStats Crime Severity Index

OpenStats

Communities ranked by Statistics Canada Crime Severity Index (Table 35-10-0026-01). Rank 1 is highest CSI (worse). Values are CMA where a metro match exists, otherwise provincial CSI. Hometown pages label the grain.

10 editions · 2016–2025

#32
Latest · 2025 · of 343
Score 114.36

Water · OpenStats

OpenStats Drinking Water Hardness

OpenStats

Communities ranked by municipal drinking-water hardness (mg/L as CaCO₃). Hardness changes slowly; the atlas vintage is carried across panel years and flagged when static for more than two years.

10 editions · 2016–2025

#309
Latest · 2025 · of 343
Score 100

Health · OpenStats

OpenStats Highest Indoor Radon

OpenStats

Communities ranked by Health Canada survey mean indoor radon (Bq/m³). Rank 1 is the highest mean. Decade panel years without a new survey carry the CMA survey vintage forward; they are not annual retests.

10 editions · 2016–2025

#182
Latest · 2025 · of 343
Score 150

Growth · OpenStats

OpenStats Population Growth

OpenStats

Cities ranked by year-over-year population growth from Statistics Canada annual CSD estimates (Table 17-10-0155-01). Rank 1 is fastest growth. A few places without a clean CSD match use a provincial-path estimate anchored to seed population.

10 editions · 2016–2025

#84
Latest · 2025 · of 343
Score 0.020009722038092714

Property tax · OpenStats

OpenStats Residential Mill Rates

OpenStats

Municipalities ranked by residential mill rate. Rank 1 is the highest rate. Published municipal years are used when available; gaps are interpolated or follow the provincial median path so the tax pillar moves year to year for every city.

10 editions · 2016–2025

#111
Latest · 2025 · of 343
Score 11.251979542139393

Livability

Globe and Mail Most Livable Cities

The Globe and Mail

2023 data partnership with Environics Analytics ranking 439 Canadian communities on ten livability categories.

Single edition · 2023

#98
Published · 2023 · of 439

Only one published edition places Red Deer in this study so far. Open the edition for method notes and the full table.

Original source · Full edition

Worth knowing in Red Deer

Distinctive local notes and places, each linked to its source.

  • Locals call themselves Red Deerians, a demonym that still shows up in hometown headlines.

    Red Deer Advocate

  • Bower Ponds sits on the Red Deer River with an amphitheatre, winter skating, and trail links into the wider park system.

    City of Red Deer

  • Westerner Days opens with a downtown parade that the city treats as the civic kickoff to fair season.

    City of Red Deer

  • Gaetz Lake Sanctuary is a large protected refuge for native plants and animals inside city limits.

    City of Red Deer

Places to see

Bower Ponds

River-overlook park where Red Deerians skate in winter and catch amphitheatre shows in warmer months. Trails link it into the broader Waskasoo Park system along the Red Deer River.

Capstone

Emerging mixed-use neighbourhood beside Greater Downtown and the Red Deer River. It is the riverside piece of the city's downtown rebuild story.

Red Deer Museum and Art Gallery

Community museum and gallery that hosts festival programming, including Heritage Day gatherings paired with Rotary Recreation Park.

Heritage Ranch

Equestrian-centred park node with trails, a trout pond, and seasonal rides. A west-side outdoor stop that feels more ranch than boulevard.

Follow Red Deer by email

When Red Deer moves in a ranking, posts new permit figures, or lands in a study, get a short note. A few sends a year, only when something changes.

No spam. Unsubscribe with one reply.

Related guides

More places in Alberta

All Alberta cities