Water System of the Month · October 2026
Thunder bay drinking water: water system of the month (october 2026)
Thunder Bay's surface-water system scores A on OpenStats with 45.8 mg/L hardness (#23 among direct-tier cities). Supply, treatment, and parameter provenance for reporters.
· OpenStats data desk · Editorial standards
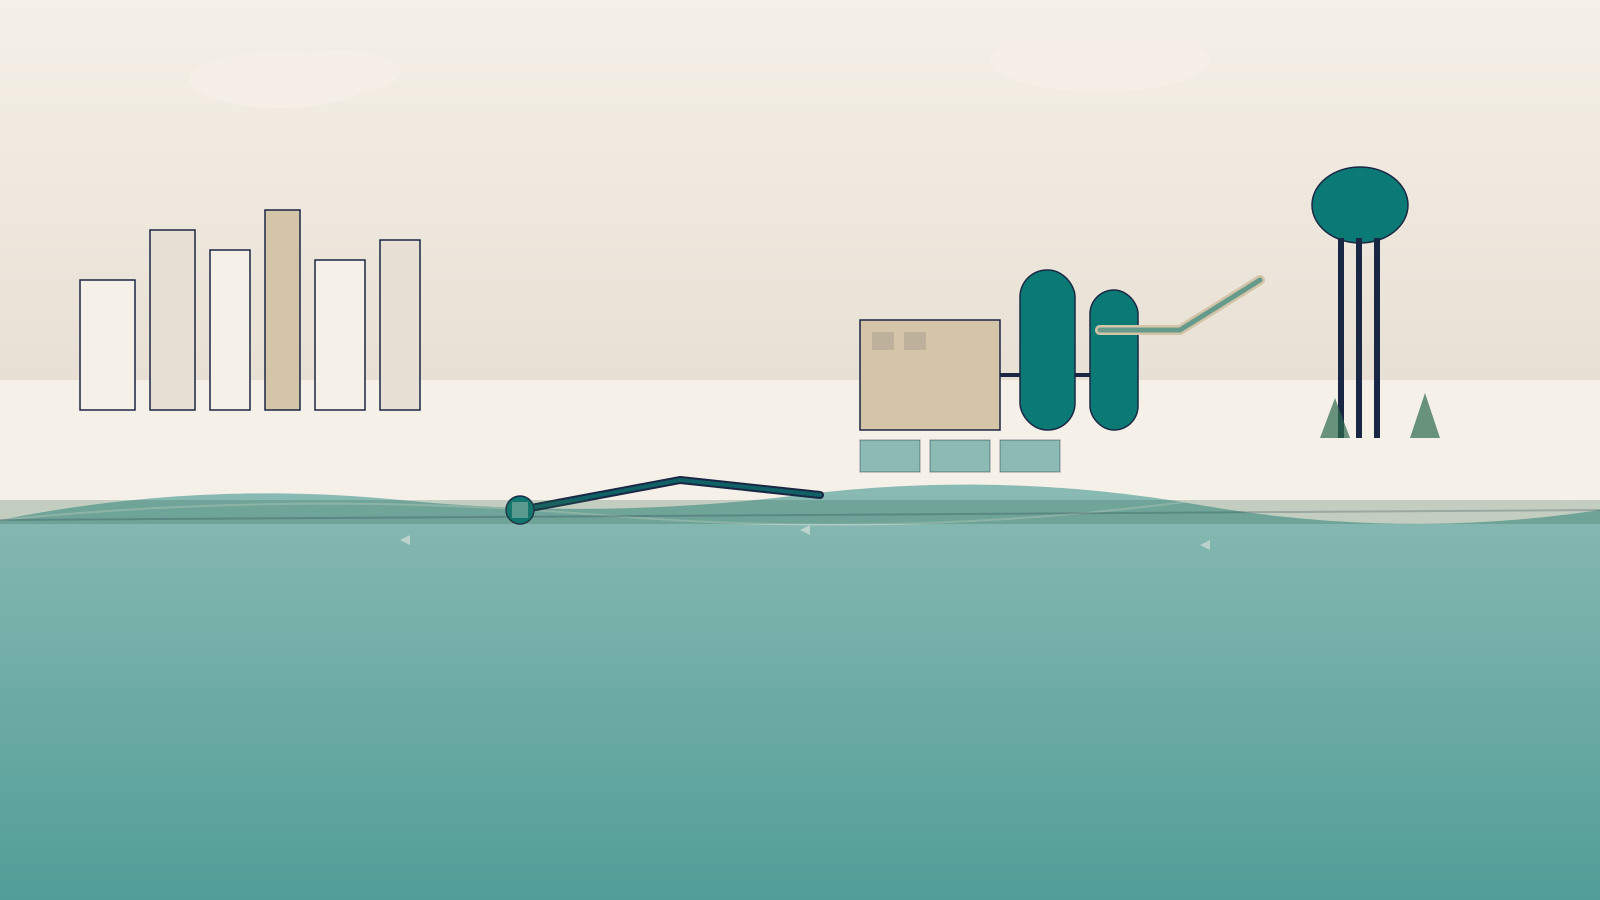
Thunder Bay is the October 2026 Water System of the Month on OpenStats. Below: how we grade the system, what the chemistry row says, where supply and treatment data come from, and which numbers are measured versus estimated.
Compare Thunder Bay vs Toronto on the city board →
Why this system matters
Thunder Bay operates one of Canada's most distinctive municipal drinking-water systems. Thunder Bay draws soft Lake Superior drinking water through a ZeeWeed membrane ultrafiltration plant at Bare Point, the city's sole residential supply since major 2007 upgrades.
On the OpenStats water atlas, Thunder Bay carries a direct-tier hardness reading and an OpenStats letter grade of A (Excellent). Among 29 direct-tier cities on the atlas, Thunder Bay ranks #23 for hardness at 45.8 mg/L (soft). The Ontario average across tracked municipalities is about 182 mg/L.
Supply and treatment
Source type on the atlas: surface. Named source waters include Lake Superior.
Treatment assets named in OpenStats supply research: Bare Point Water Treatment Plant (City-owned plant on Lakeshore Drive / Bare Point. ZeeWeed membrane ultrafiltration and sodium hypochlorite disinfection. Operational capacity 113.5 million litres per day. Main intake roughly 730 m offshore at about 10 m depth; gravity feed into the plant.).
Single-source system delivering through eight pressure zones, seven pump stations, four reservoirs, and one standpipe across the city. Bare Point has been the sole municipal residential supply since major 2007 upgrades.
OpenStats score and ranking context
OpenStats grades drinking water A through D using Health Canada guideline limits on pH, lead, fluoride, chlorine, and turbidity, with a B grade when health parameters comply but hardness exceeds 180 mg/L or turbidity sits above the typical 1 NTU target. Thunder Bay scores A on the current row: Excellent.
Hardness 45.8 mg/L as CaCO₃ is from a published municipal source (2025). That figure is 136 mg/L below the Ontario average (182 mg/L across 123 tracked municipalities).
Compare neighbours on the water atlas hardness sort, the hub hardness guide, and the Thunder Bay hometown page for City Score context.
What is measured vs estimated
OpenStats labels every parameter row. Hardness on direct-tier cities comes from a cited municipal or regional report. pH is only treated as measured when the same verified source published it. Lead, fluoride, chlorine, and turbidity on this page remain atlas seed values unless the data_source field names a municipal lab report.
For Thunder Bay, hardness is verified from City of Thunder Bay 2025 Drinking Water Quality Annual Report (2025). pH is from the same verified source. Other health parameters in the table below are seed rows and should not be read as a current compliance certificate.
Always open the City of Thunder Bay annual water services reports linked in the supply profile for operational compliance data.
For reporters
Share URL for this edition: https://openstats.ca/news/water-system-of-month/thunder-bay-on-2026-10/
Water atlas city page: https://water.openstats.ca/water/thunder-bay-on/
Hometown rankings: https://openstats.ca/cities/thunder-bay-on/
OpenStats data desk · [email protected]
Parameter table
| Parameter | Value | Guideline | Status | Provenance |
|---|---|---|---|---|
| Hardness | 45.8 mg/L | No MAC (aesthetic) | Soft | Measured |
| pH | 8.02 | 6.5–8.5 | Compliant | Measured |
| Lead | 0.5 μg/L | ≤ 5 μg/L | Compliant | Estimated |
| Fluoride | 0.02 mg/L | ≤ 1.5 mg/L | Compliant | Measured |
| Chlorine | 1.43 mg/L | ≤ 4 mg/L | Compliant | Measured |
| Turbidity | 0 NTU | ≤ 1 NTU (typical) | Compliant | Measured |
Provenance notes: Hardness: City of Thunder Bay 2025 Drinking Water Quality Annual Report (2025) · pH: City of Thunder Bay 2025 Drinking Water Quality Annual Report (2025) · Lead: Atlas seed row (not from municipal report) · Fluoride: City of Thunder Bay 2025 Drinking Water Quality Annual Report (2025); Reported as below detection limit (<0.020 mg/L); table uses 0.02 mg/L cap · Chlorine: City of Thunder Bay 2025 Drinking Water Quality Annual Report (2025) · Turbidity: City of Thunder Bay 2025 Drinking Water Quality Annual Report (2025)
Map and atlas links
Open the water atlas page for Thunder Bay for the full grade gauge, provincial comparison bars, and supply narrative. The hometown arena card lives on Thunder Bay's OpenStats city page.
Map data © OpenStreetMap contributors. Utility service area may extend beyond the marker.
Public sources cited
- City of Thunder Bay — Drinking water
- Lakehead Region Conservation Authority — Bare Point intake fact sheet
Reporter share URL
https://openstats.ca/news/water-system-of-month/thunder-bay-on-2026-10/
Questions: [email protected]